| Red | Green | Blue | |
| z | 17.64 | ||
| znorm | Inf | ||
| sky | -Inf | -Inf | -Inf |
| S/N | 30.5 | 49.4 | 54.0 |
| S/N(c) | 0.0 | 0.0 | 0.0 |
| SN(E/C) |
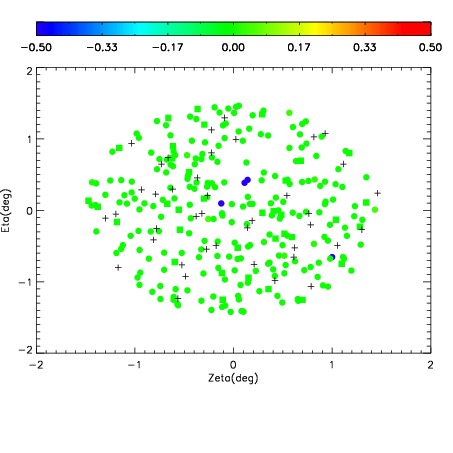
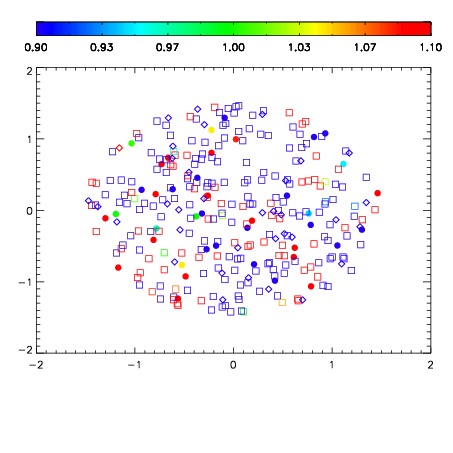
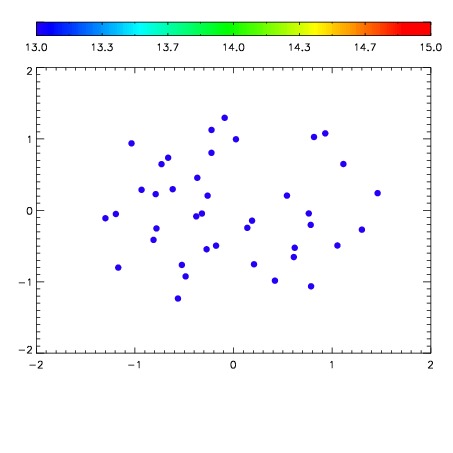

| Frame | Nreads | Zeropoints | Mag plots | Spatial mag deviation | Spatial sky 16325A emission deviations (filled: sky, open: star) | Spatial sky continuum emission | Spatial sky telluric CO2 absorption deviations (filled: H < 10) | |||||||||||||||||||||||
| 0 | 0 |
|
|
|
|
|
|
| IPAIR | NAME | SHIFT | NEWSHIFT | S/N | NAME | SHIFT | NEWSHIFT | S/N |
| 0 | 04060054 | 0.494307 | 0.00000 | 19.1118 | 04060052 | -0.00122950 | 0.495537 | 19.1013 |
| 1 | 04060050 | 0.491569 | 0.00273800 | 19.1465 | 04060048 | 0.00000 | 0.494307 | 19.1149 |
| 2 | 04060053 | 0.492987 | 0.00132000 | 19.1348 | 04060051 | -0.000788577 | 0.495096 | 19.1113 |
| 3 | 04060049 | 0.490241 | 0.00406602 | 19.1173 | 04060055 | 0.00145444 | 0.492853 | 19.1029 |