| Red | Green | Blue | |
| z | 17.64 | ||
| znorm | Inf | ||
| sky | -Inf | -Inf | -Inf |
| S/N | 22.9 | 35.9 | 41.2 |
| S/N(c) | 0.0 | 0.0 | 0.0 |
| SN(E/C) |
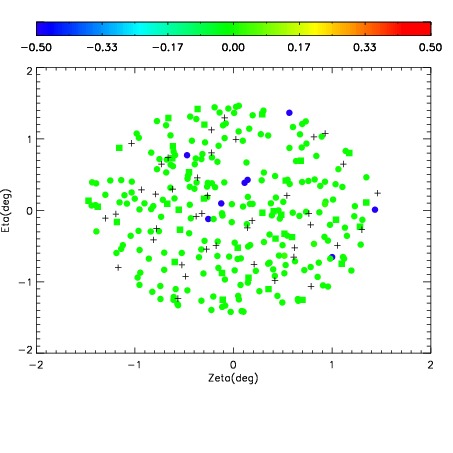
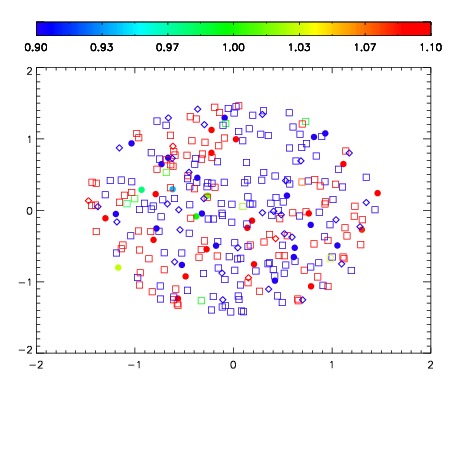


| Frame | Nreads | Zeropoints | Mag plots | Spatial mag deviation | Spatial sky 16325A emission deviations (filled: sky, open: star) | Spatial sky continuum emission | Spatial sky telluric CO2 absorption deviations (filled: H < 10) | |||||||||||||||||||||||
| 0 | 0 |
|
|
|
|
|
|
| IPAIR | NAME | SHIFT | NEWSHIFT | S/N | NAME | SHIFT | NEWSHIFT | S/N |
| 0 | 04600042 | 0.495643 | 0.00000 | 18.9560 | 04600039 | 0.000846730 | 0.494796 | 19.0260 |
| 1 | 04600038 | 0.494330 | 0.00131300 | 18.8907 | 04600040 | 0.000926145 | 0.494717 | 18.9694 |
| 2 | 04600037 | 0.494296 | 0.00134698 | 18.8897 | 04600043 | 0.000633956 | 0.495009 | 18.9028 |
| 3 | 04600041 | 0.493947 | 0.00169599 | 18.7219 | 04600036 | 0.00000 | 0.495643 | 18.8782 |