| Red | Green | Blue | |
| z | 17.64 | ||
| znorm | Inf | ||
| sky | -Inf | -Inf | -NaN |
| S/N | 27.2 | 44.8 | 48.7 |
| S/N(c) | 0.0 | 0.0 | 0.0 |
| SN(E/C) |
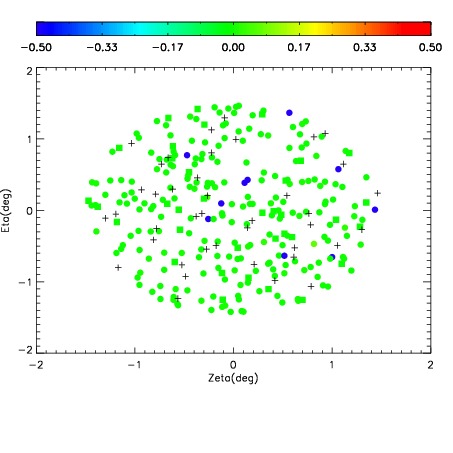
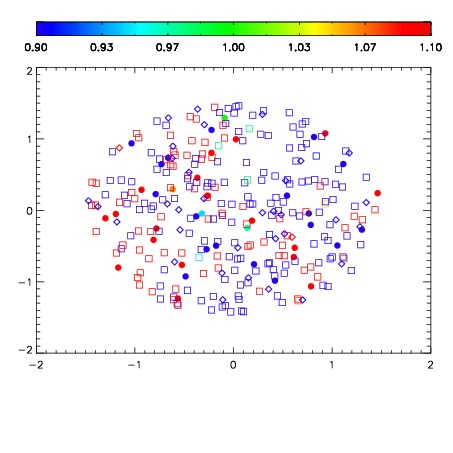
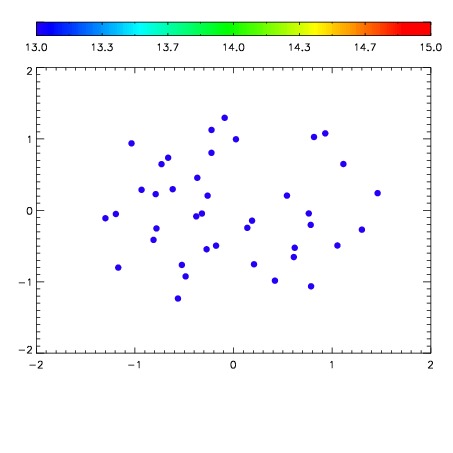

| Frame | Nreads | Zeropoints | Mag plots | Spatial mag deviation | Spatial sky 16325A emission deviations (filled: sky, open: star) | Spatial sky continuum emission | Spatial sky telluric CO2 absorption deviations (filled: H < 10) | |||||||||||||||||||||||
| 0 | 0 |
|
|
|
|
|
|
| IPAIR | NAME | SHIFT | NEWSHIFT | S/N | NAME | SHIFT | NEWSHIFT | S/N |
| 0 | 08170024 | 0.515761 | 0.00000 | 19.0479 | 08170025 | -0.00147114 | 0.517232 | 18.9968 |
| 1 | 08170028 | 0.513269 | 0.00249201 | 19.1238 | 08170029 | 4.51570e-05 | 0.515716 | 19.1181 |
| 2 | 08170027 | 0.512030 | 0.00373101 | 19.0930 | 08170026 | -0.00131015 | 0.517071 | 19.0265 |
| 3 | 08170023 | 0.507835 | 0.00792605 | 18.9873 | 08170022 | 0.00000 | 0.515761 | 18.6581 |