| Red | Green | Blue | |
| z | 17.64 | ||
| znorm | Inf | ||
| sky | -Inf | -Inf | -Inf |
| S/N | 19.1 | 34.1 | 36.6 |
| S/N(c) | 0.0 | 0.0 | 0.0 |
| SN(E/C) |
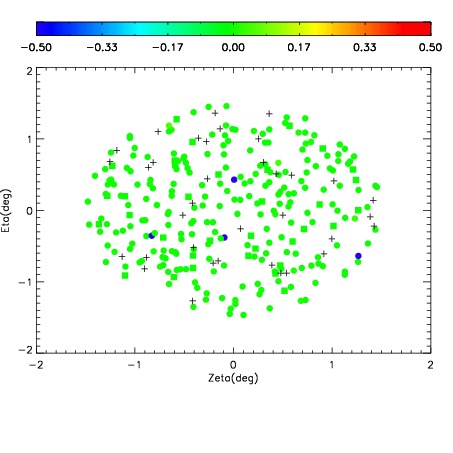
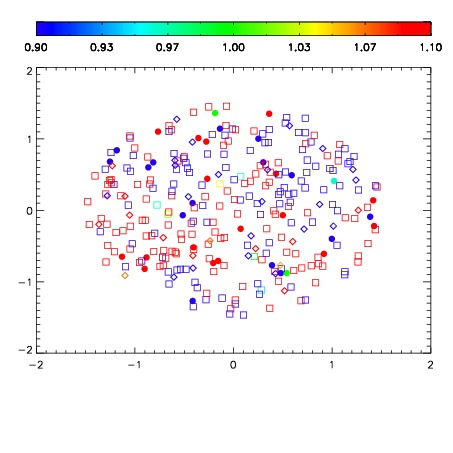


| Frame | Nreads | Zeropoints | Mag plots | Spatial mag deviation | Spatial sky 16325A emission deviations (filled: sky, open: star) | Spatial sky continuum emission | Spatial sky telluric CO2 absorption deviations (filled: H < 10) | |||||||||||||||||||||||
| 0 | 0 |
|
|
|
|
|
|
| IPAIR | NAME | SHIFT | NEWSHIFT | S/N | NAME | SHIFT | NEWSHIFT | S/N |
| 0 | 04030068 | 0.503490 | 0.00000 | 18.9257 | 04030069 | 0.00167347 | 0.501817 | 18.8973 |
| 1 | 04030067 | 0.502477 | 0.00101298 | 18.8693 | 04030066 | 0.000616060 | 0.502874 | 18.8306 |
| 2 | 04030064 | 0.500433 | 0.00305694 | 18.4764 | 04030065 | 0.00242268 | 0.501067 | 18.8159 |
| 3 | 04030063 | 0.499418 | 0.00407198 | 18.3887 | 04030062 | 0.00000 | 0.503490 | 18.2288 |