| Red | Green | Blue | |
| z | 17.64 | ||
| znorm | Inf | ||
| sky | -NaN | -NaN | -Inf |
| S/N | 21.5 | 38.4 | 41.7 |
| S/N(c) | 0.0 | 0.0 | 0.0 |
| SN(E/C) |
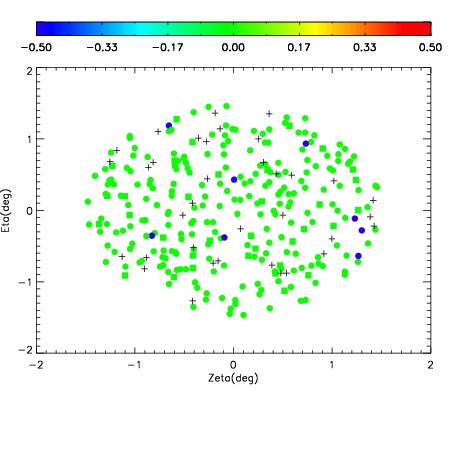
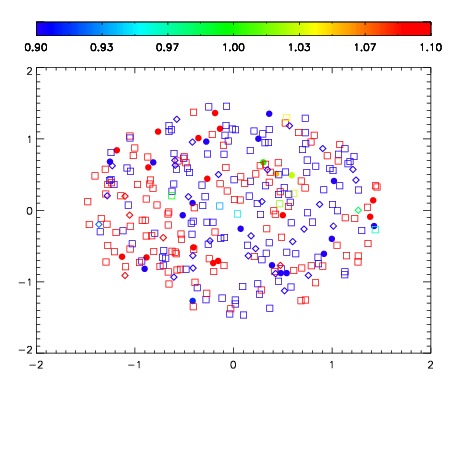


| Frame | Nreads | Zeropoints | Mag plots | Spatial mag deviation | Spatial sky 16325A emission deviations (filled: sky, open: star) | Spatial sky continuum emission | Spatial sky telluric CO2 absorption deviations (filled: H < 10) | |||||||||||||||||||||||
| 0 | 0 |
|
|
|
|
|
|
| IPAIR | NAME | SHIFT | NEWSHIFT | S/N | NAME | SHIFT | NEWSHIFT | S/N |
| 0 | 08450012 | 0.487856 | 0.00000 | 18.8693 | 08450013 | 0.00298621 | 0.484870 | 18.8694 |
| 1 | 08450011 | 0.487617 | 0.000239015 | 18.7926 | 08450010 | 0.00000 | 0.487856 | 18.8419 |
| 2 | 08450015 | 0.487121 | 0.000735015 | 18.7868 | 08450014 | 0.00260878 | 0.485247 | 18.6845 |
| 3 | 08450016 | 0.487182 | 0.000674009 | 18.7731 | 08450017 | 0.00197959 | 0.485876 | 18.6261 |