| Red | Green | Blue | |
| z | 17.64 | ||
| znorm | Inf | ||
| sky | -Inf | -Inf | -Inf |
| S/N | 15.7 | 28.3 | 30.6 |
| S/N(c) | 0.0 | 0.0 | 0.0 |
| SN(E/C) |
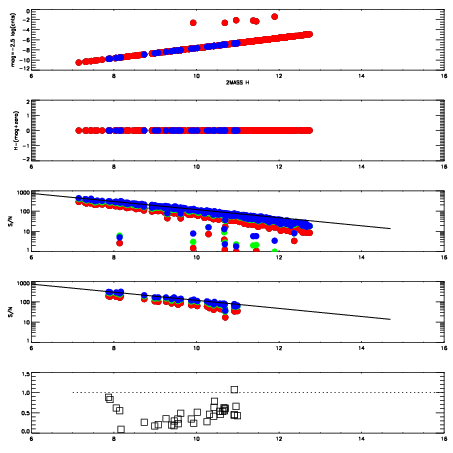
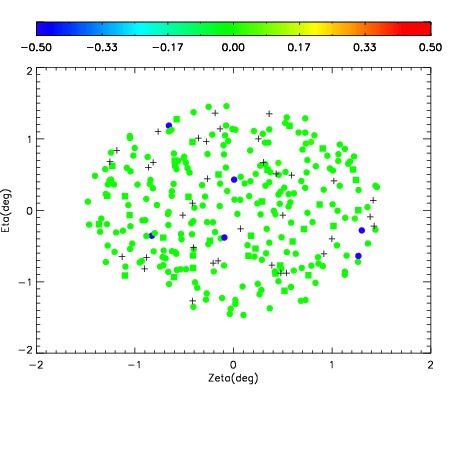

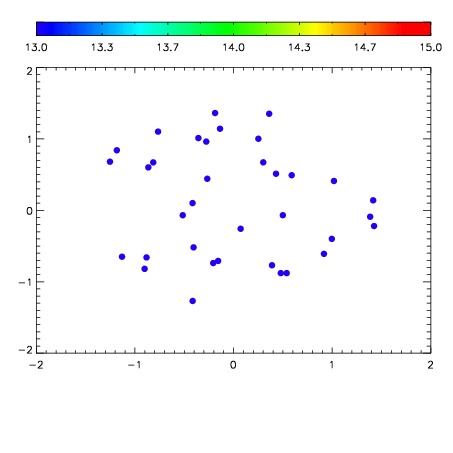

| Frame | Nreads | Zeropoints | Mag plots | Spatial mag deviation | Spatial sky 16325A emission deviations (filled: sky, open: star) | Spatial sky continuum emission | Spatial sky telluric CO2 absorption deviations (filled: H < 10) | |||||||||||||||||||||||
| 0 | 0 |
|
|
|
|
|
|
| IPAIR | NAME | SHIFT | NEWSHIFT | S/N | NAME | SHIFT | NEWSHIFT | S/N |
| 0 | 10810090 | 0.483820 | 0.00000 | 18.3840 | 10810088 | 0.000970575 | 0.482849 | 18.2552 |
| 1 | 10810087 | 0.482887 | 0.000932992 | 18.4664 | 10810092 | -0.000746662 | 0.484567 | 18.3161 |
| 2 | 10810086 | 0.482838 | 0.000981987 | 18.4362 | 10810085 | 0.00000 | 0.483820 | 18.2789 |
| 3 | 10810091 | 0.483577 | 0.000242978 | 18.3653 | 10810089 | 0.00130609 | 0.482514 | 18.2074 |