| Red | Green | Blue | |
| z | 17.64 | ||
| znorm | Inf | ||
| sky | -NaN | -Inf | -Inf |
| S/N | 21.4 | 40.6 | 42.4 |
| S/N(c) | 0.0 | 0.0 | 0.0 |
| SN(E/C) |
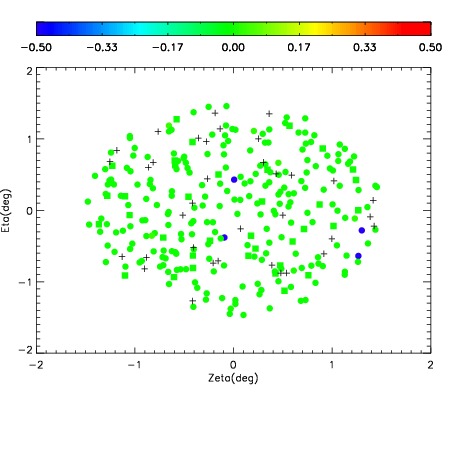
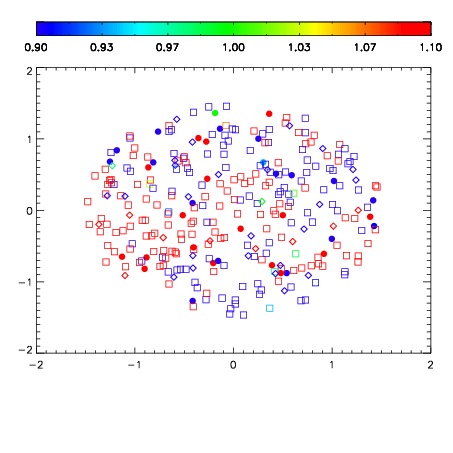
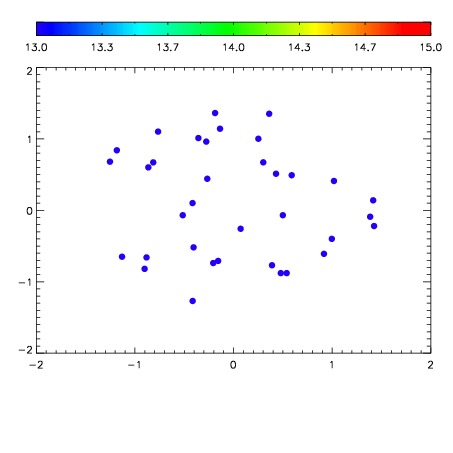

| Frame | Nreads | Zeropoints | Mag plots | Spatial mag deviation | Spatial sky 16325A emission deviations (filled: sky, open: star) | Spatial sky continuum emission | Spatial sky telluric CO2 absorption deviations (filled: H < 10) | |||||||||||||||||||||||
| 0 | 0 |
|
|
|
|
|
|
| IPAIR | NAME | SHIFT | NEWSHIFT | S/N | NAME | SHIFT | NEWSHIFT | S/N |
| 0 | 10910087 | 0.512815 | 0.00000 | 18.4772 | 10910077 | 0.00000 | 0.512815 | 18.4626 |
| 1 | 10910083 | 0.511683 | 0.00113201 | 18.6943 | 10910084 | -0.00218588 | 0.515001 | 18.6255 |
| 2 | 10910078 | 0.510027 | 0.00278801 | 18.6934 | 10910081 | -0.00157916 | 0.514394 | 18.6028 |
| 3 | 10910079 | 0.511192 | 0.00162297 | 18.6450 | 10910085 | -0.00168151 | 0.514497 | 18.5692 |
| 4 | 10910086 | 0.512059 | 0.000756025 | 18.5394 | 10910080 | -0.00196756 | 0.514783 | 18.5324 |
| 5 | 10910082 | 0.511486 | 0.00132900 | 18.1908 | 10910088 | -0.000512855 | 0.513328 | 18.2404 |