| Red | Green | Blue | |
| z | 17.64 | ||
| znorm | Inf | ||
| sky | -NaN | -Inf | -Inf |
| S/N | 27.3 | 48.0 | 51.8 |
| S/N(c) | 0.0 | 0.0 | 0.0 |
| SN(E/C) |
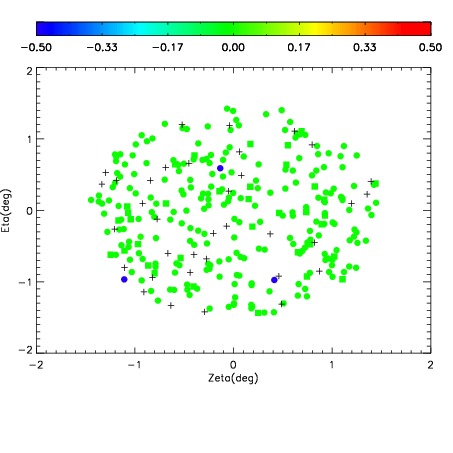
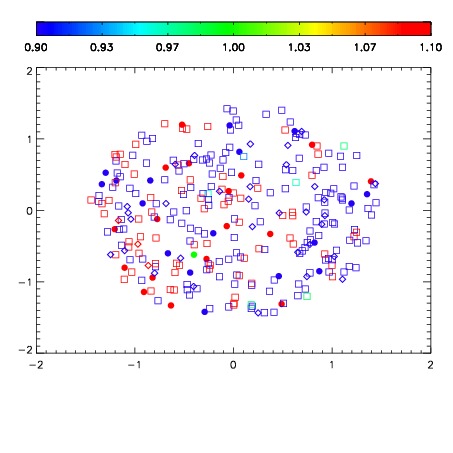
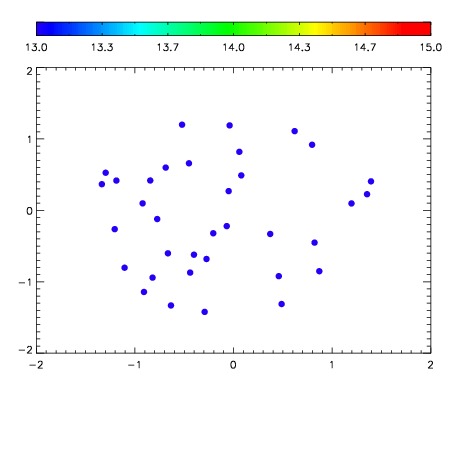

| Frame | Nreads | Zeropoints | Mag plots | Spatial mag deviation | Spatial sky 16325A emission deviations (filled: sky, open: star) | Spatial sky continuum emission | Spatial sky telluric CO2 absorption deviations (filled: H < 10) | |||||||||||||||||||||||
| 0 | 0 |
|
|
|
|
|
|
| IPAIR | NAME | SHIFT | NEWSHIFT | S/N | NAME | SHIFT | NEWSHIFT | S/N |
| 0 | 04060043 | 0.496383 | 0.00000 | 19.1082 | 04060040 | 0.00155626 | 0.494827 | 19.0666 |
| 1 | 04060042 | 0.494830 | 0.00155300 | 19.0260 | 04060044 | 0.00312944 | 0.493254 | 19.0609 |
| 2 | 04060039 | 0.493460 | 0.00292301 | 18.9380 | 04060041 | 0.00152479 | 0.494858 | 19.0279 |
| 3 | 04060038 | 0.492433 | 0.00395000 | 18.8658 | 04060037 | 0.00000 | 0.496383 | 18.8937 |