| Red | Green | Blue | |
| z | 17.64 | ||
| znorm | Inf | ||
| sky | -Inf | -NaN | -Inf |
| S/N | 24.2 | 41.9 | 45.7 |
| S/N(c) | 0.0 | 0.0 | 0.0 |
| SN(E/C) |
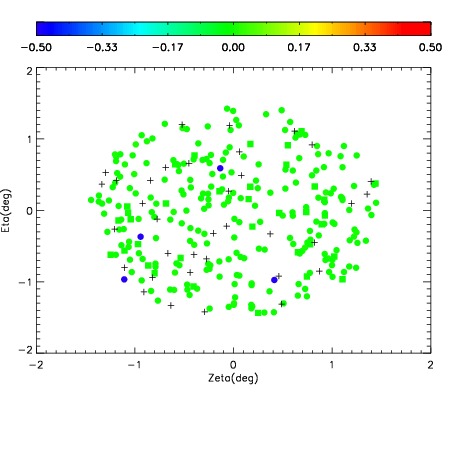
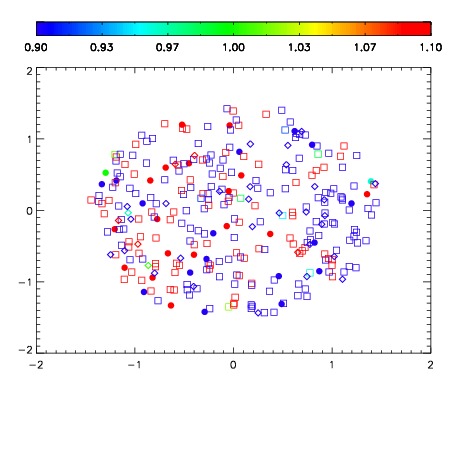
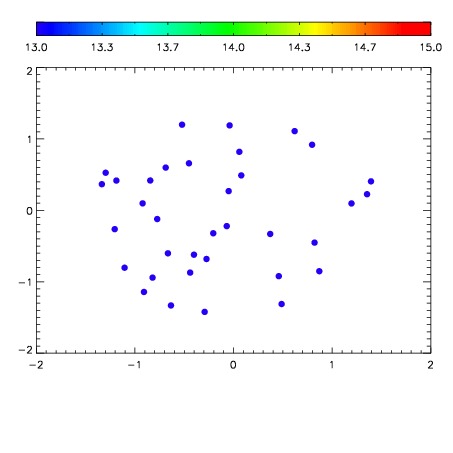

| Frame | Nreads | Zeropoints | Mag plots | Spatial mag deviation | Spatial sky 16325A emission deviations (filled: sky, open: star) | Spatial sky continuum emission | Spatial sky telluric CO2 absorption deviations (filled: H < 10) | |||||||||||||||||||||||
| 0 | 0 |
|
|
|
|
|
|
| IPAIR | NAME | SHIFT | NEWSHIFT | S/N | NAME | SHIFT | NEWSHIFT | S/N |
| 0 | 08470036 | 0.487137 | 0.00000 | 18.9577 | 08470038 | 0.00371556 | 0.483421 | 18.5224 |
| 1 | 08470040 | 0.486268 | 0.000868976 | 19.0203 | 08470041 | 0.00409252 | 0.483044 | 18.9715 |
| 2 | 08470039 | 0.485154 | 0.00198299 | 18.9817 | 08470034 | 0.00000 | 0.487137 | 18.9382 |
| 3 | 08470035 | 0.486902 | 0.000234991 | 18.9805 | 08470037 | 0.00626143 | 0.480876 | 18.7513 |