| Red | Green | Blue | |
| z | 17.64 | ||
| znorm | Inf | ||
| sky | -Inf | -Inf | -Inf |
| S/N | 26.3 | 46.8 | 51.0 |
| S/N(c) | 0.0 | 0.0 | 0.0 |
| SN(E/C) |
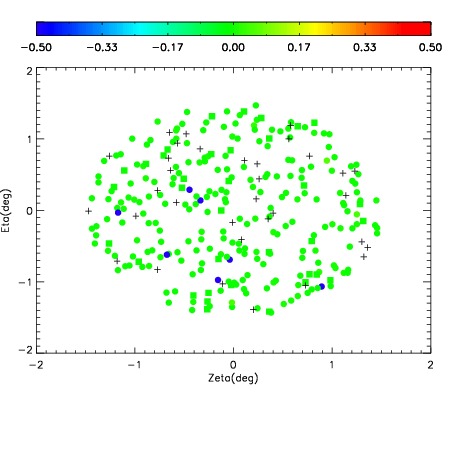
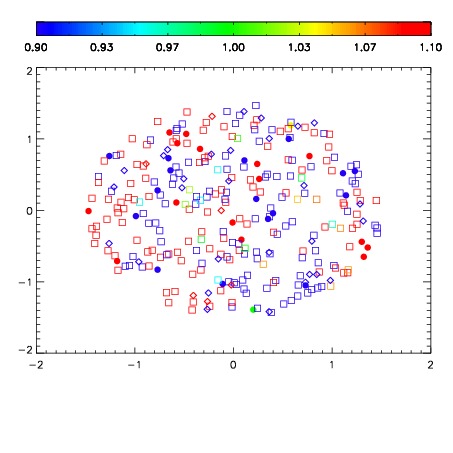
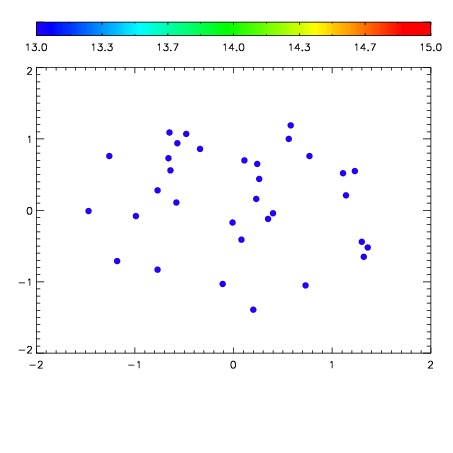

| Frame | Nreads | Zeropoints | Mag plots | Spatial mag deviation | Spatial sky 16325A emission deviations (filled: sky, open: star) | Spatial sky continuum emission | Spatial sky telluric CO2 absorption deviations (filled: H < 10) | |||||||||||||||||||||||
| 0 | 0 |
|
|
|
|
|
|
| IPAIR | NAME | SHIFT | NEWSHIFT | S/N | NAME | SHIFT | NEWSHIFT | S/N |
| 0 | 11350075 | 0.480973 | 0.00000 | 18.9957 | 11350073 | -0.000179330 | 0.481152 | 18.9789 |
| 1 | 11350078 | 0.480838 | 0.000135005 | 19.0153 | 11350077 | -0.000138118 | 0.481111 | 19.0794 |
| 2 | 11350074 | 0.480508 | 0.000465006 | 19.0099 | 11350076 | -0.000354109 | 0.481327 | 19.0356 |
| 3 | 11350070 | 0.478310 | 0.00266302 | 18.8781 | 11350072 | -0.00109932 | 0.482072 | 18.8381 |
| 4 | 11350071 | 0.480470 | 0.000503004 | 18.8297 | 11350069 | 0.00000 | 0.480973 | 18.6904 |