| Red | Green | Blue | |
| z | 17.64 | ||
| znorm | Inf | ||
| sky | -Inf | -Inf | -Inf |
| S/N | 14.3 | 25.3 | 28.4 |
| S/N(c) | 0.0 | 0.0 | 0.0 |
| SN(E/C) |
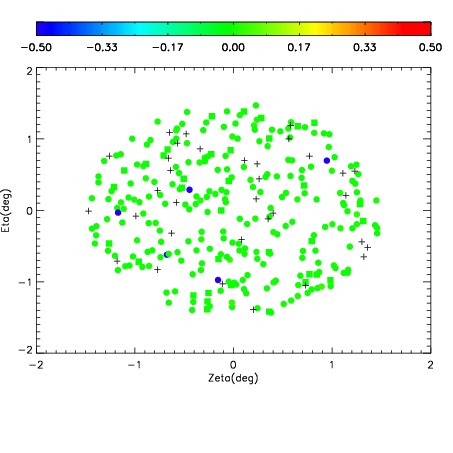
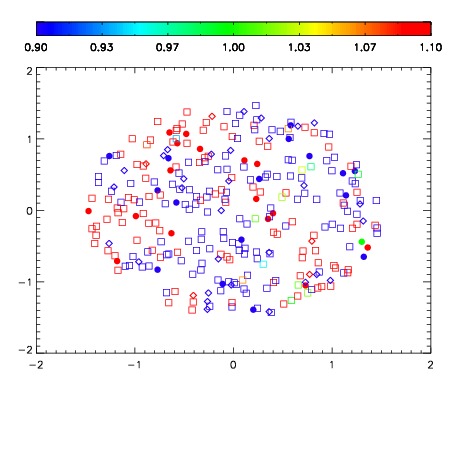
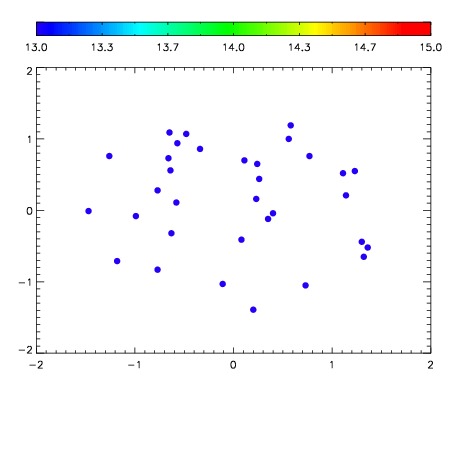

| Frame | Nreads | Zeropoints | Mag plots | Spatial mag deviation | Spatial sky 16325A emission deviations (filled: sky, open: star) | Spatial sky continuum emission | Spatial sky telluric CO2 absorption deviations (filled: H < 10) | |||||||||||||||||||||||
| 0 | 0 |
|
|
|
|
|
|
| IPAIR | NAME | SHIFT | NEWSHIFT | S/N | NAME | SHIFT | NEWSHIFT | S/N |
| 0 | 11730049 | 0.492082 | 0.00000 | 17.0498 | 11730051 | -0.00447683 | 0.496559 | 17.1572 |
| 1 | 11730046 | 0.491070 | 0.00101200 | 18.7613 | 11730047 | -0.00316116 | 0.495243 | 18.7124 |
| 2 | 11730045 | 0.491153 | 0.000928998 | 18.1671 | 11730048 | -0.00337365 | 0.495456 | 18.5724 |
| 3 | 11730050 | 0.491520 | 0.000562012 | 17.4362 | 11730044 | 0.00000 | 0.492082 | 18.5696 |