| Red | Green | Blue | |
| z | 17.64 | ||
| znorm | Inf | ||
| sky | -Inf | -Inf | -Inf |
| S/N | 22.1 | 39.7 | 42.5 |
| S/N(c) | 0.0 | 0.0 | 0.0 |
| SN(E/C) |
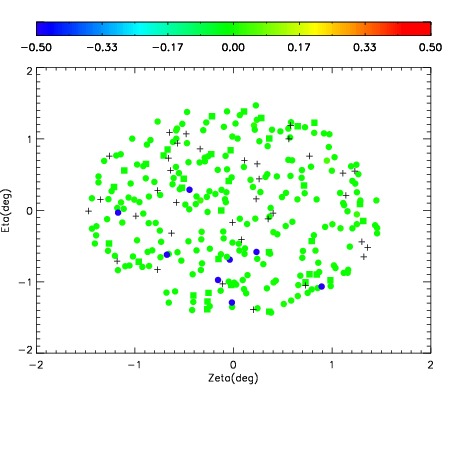
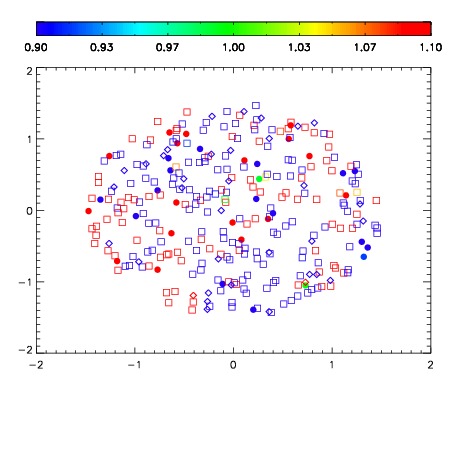


| Frame | Nreads | Zeropoints | Mag plots | Spatial mag deviation | Spatial sky 16325A emission deviations (filled: sky, open: star) | Spatial sky continuum emission | Spatial sky telluric CO2 absorption deviations (filled: H < 10) | |||||||||||||||||||||||
| 0 | 0 |
|
|
|
|
|
|
| IPAIR | NAME | SHIFT | NEWSHIFT | S/N | NAME | SHIFT | NEWSHIFT | S/N |
| 0 | 12000028 | 0.503005 | 0.00000 | 18.7431 | 12000029 | -0.00143737 | 0.504442 | 18.7928 |
| 1 | 12000027 | 0.501679 | 0.00132602 | 18.8362 | 12000026 | -0.00400356 | 0.507009 | 18.8279 |
| 2 | 12000024 | 0.500777 | 0.00222802 | 18.8205 | 12000025 | -0.00431613 | 0.507321 | 18.7979 |
| 3 | 12000023 | 0.500003 | 0.00300205 | 18.7107 | 12000022 | 0.00000 | 0.503005 | 18.6072 |