| Red | Green | Blue | |
| z | 17.64 | ||
| znorm | Inf | ||
| sky | -Inf | -Inf | -Inf |
| S/N | 24.1 | 42.3 | 45.8 |
| S/N(c) | 0.0 | 0.0 | 0.0 |
| SN(E/C) |


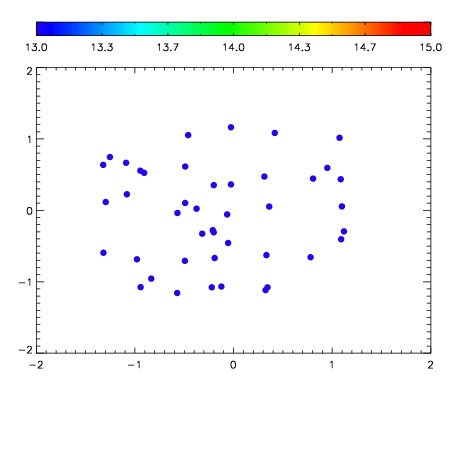

| Frame | Nreads | Zeropoints | Mag plots | Spatial mag deviation | Spatial sky 16325A emission deviations (filled: sky, open: star) | Spatial sky continuum emission | Spatial sky telluric CO2 absorption deviations (filled: H < 10) | |||||||||||||||||||||||
| 0 | 0 |
|
|
|
|
|
|
| IPAIR | NAME | SHIFT | NEWSHIFT | S/N | NAME | SHIFT | NEWSHIFT | S/N |
| 0 | 04050071 | 0.499020 | 0.00000 | 18.7828 | 04050076 | 0.00197712 | 0.497043 | 18.8734 |
| 1 | 04050074 | 0.494839 | 0.00418100 | 19.0356 | 04050073 | -7.24080e-06 | 0.499027 | 19.0166 |
| 2 | 04050075 | 0.497586 | 0.00143400 | 18.9729 | 04050072 | 0.000659472 | 0.498361 | 18.9185 |
| 3 | 04050070 | 0.498927 | 9.30130e-05 | 18.7643 | 04050069 | 0.00000 | 0.499020 | 18.6107 |