| Red | Green | Blue | |
| z | 17.64 | ||
| znorm | Inf | ||
| sky | -Inf | -NaN | -Inf |
| S/N | 28.3 | 47.5 | 52.2 |
| S/N(c) | 0.0 | 0.0 | 0.0 |
| SN(E/C) |
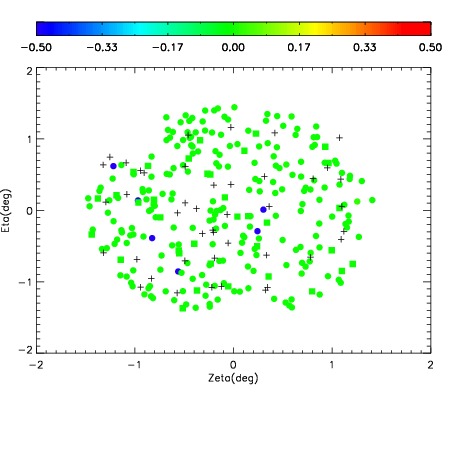
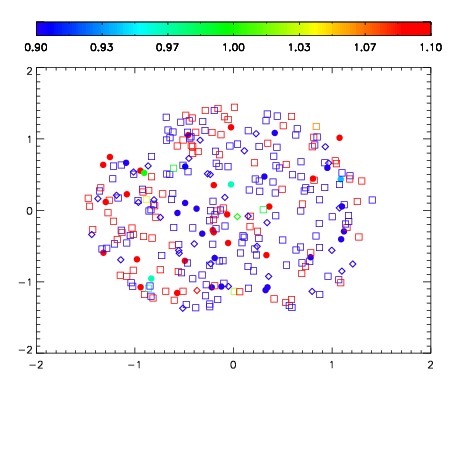
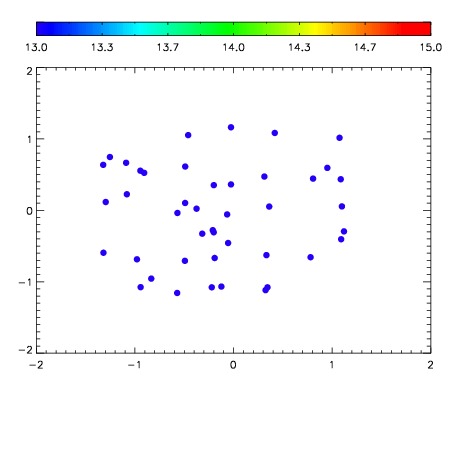

| Frame | Nreads | Zeropoints | Mag plots | Spatial mag deviation | Spatial sky 16325A emission deviations (filled: sky, open: star) | Spatial sky continuum emission | Spatial sky telluric CO2 absorption deviations (filled: H < 10) | |||||||||||||||||||||||
| 0 | 0 |
|
|
|
|
|
|
| IPAIR | NAME | SHIFT | NEWSHIFT | S/N | NAME | SHIFT | NEWSHIFT | S/N |
| 0 | 04650012 | 0.490633 | 0.00000 | 19.1208 | 04650017 | 0.00296037 | 0.487673 | 19.1033 |
| 1 | 04650016 | 0.490098 | 0.000535011 | 19.1790 | 04650014 | 0.00210246 | 0.488531 | 19.1667 |
| 2 | 04650015 | 0.489142 | 0.00149101 | 19.1629 | 04650013 | -3.39210e-05 | 0.490667 | 19.1413 |
| 3 | 04650011 | 0.489379 | 0.00125402 | 19.0865 | 04650010 | 0.00000 | 0.490633 | 19.0270 |