| Red | Green | Blue | |
| z | 17.64 | ||
| znorm | Inf | ||
| sky | -Inf | -Inf | -Inf |
| S/N | 24.7 | 42.8 | 47.4 |
| S/N(c) | 0.0 | 0.0 | 0.0 |
| SN(E/C) |
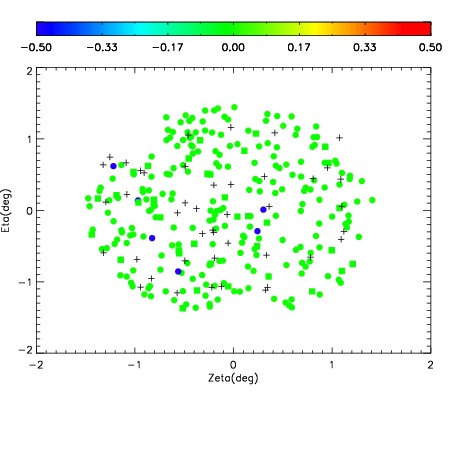
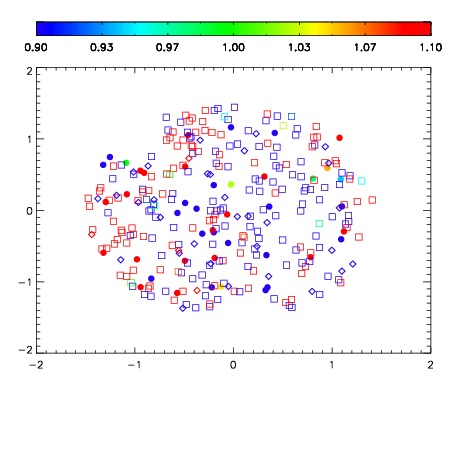
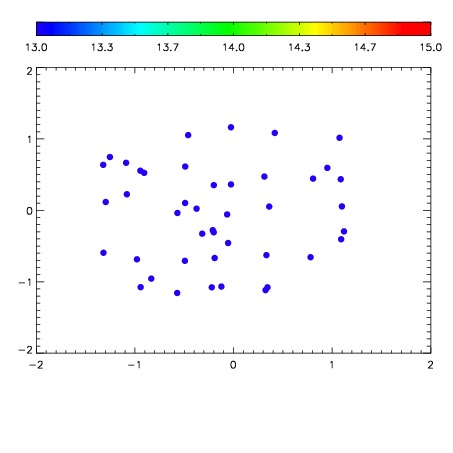

| Frame | Nreads | Zeropoints | Mag plots | Spatial mag deviation | Spatial sky 16325A emission deviations (filled: sky, open: star) | Spatial sky continuum emission | Spatial sky telluric CO2 absorption deviations (filled: H < 10) | |||||||||||||||||||||||
| 0 | 0 |
|
|
|
|
|
|
| IPAIR | NAME | SHIFT | NEWSHIFT | S/N | NAME | SHIFT | NEWSHIFT | S/N |
| 0 | 04890038 | 0.489310 | 0.00000 | 18.8762 | 04890039 | -0.00502104 | 0.494331 | 18.9427 |
| 1 | 04890042 | 0.485488 | 0.00382200 | 18.9819 | 04890043 | -0.00515671 | 0.494467 | 18.9747 |
| 2 | 04890041 | 0.485212 | 0.00409800 | 18.9713 | 04890040 | -0.00560024 | 0.494910 | 18.9714 |
| 3 | 04890037 | 0.485595 | 0.00371501 | 18.8586 | 04890036 | 0.00000 | 0.489310 | 18.7523 |