| Red | Green | Blue | |
| z | 17.64 | ||
| znorm | Inf | ||
| sky | -Inf | -Inf | -Inf |
| S/N | 20.1 | 36.1 | 38.7 |
| S/N(c) | 0.0 | 0.0 | 0.0 |
| SN(E/C) |


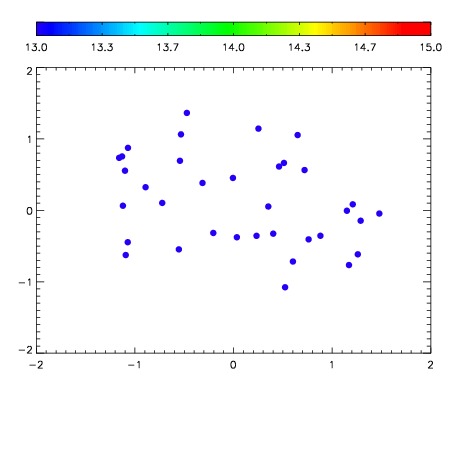

| Frame | Nreads | Zeropoints | Mag plots | Spatial mag deviation | Spatial sky 16325A emission deviations (filled: sky, open: star) | Spatial sky continuum emission | Spatial sky telluric CO2 absorption deviations (filled: H < 10) | |||||||||||||||||||||||
| 0 | 0 |
|
|
|
|
|
|
| IPAIR | NAME | SHIFT | NEWSHIFT | S/N | NAME | SHIFT | NEWSHIFT | S/N |
| 0 | 11720060 | 0.494434 | 0.00000 | 18.5836 | 11720062 | -0.00429918 | 0.498733 | 18.5265 |
| 1 | 11720061 | 0.493957 | 0.000476986 | 18.6930 | 11720055 | 0.00000 | 0.494434 | 18.7028 |
| 2 | 11720056 | 0.493084 | 0.00134999 | 18.6822 | 11720058 | -0.00201030 | 0.496444 | 18.7017 |
| 3 | 11720057 | 0.493225 | 0.00120899 | 18.6472 | 11720059 | -0.00227789 | 0.496712 | 18.5991 |