| Red | Green | Blue | |
| z | 17.64 | ||
| znorm | Inf | ||
| sky | -Inf | -NaN | -Inf |
| S/N | 22.0 | 37.3 | 39.9 |
| S/N(c) | 0.0 | 0.0 | 0.0 |
| SN(E/C) |
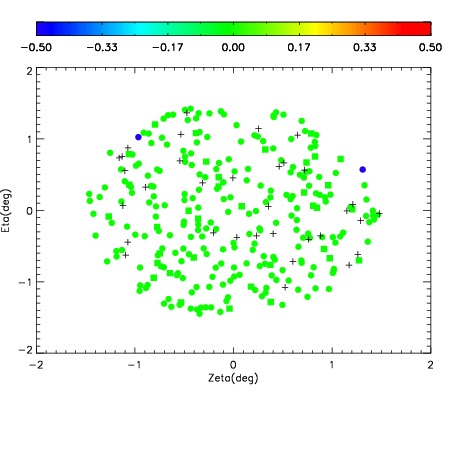
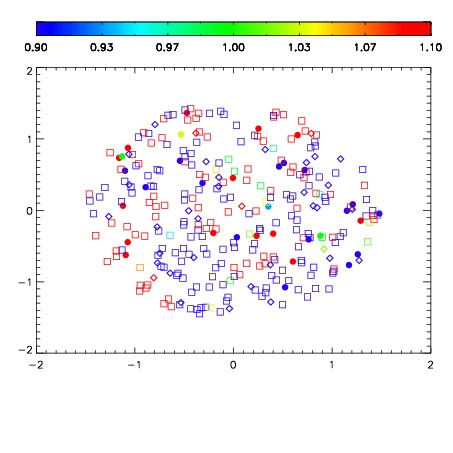


| Frame | Nreads | Zeropoints | Mag plots | Spatial mag deviation | Spatial sky 16325A emission deviations (filled: sky, open: star) | Spatial sky continuum emission | Spatial sky telluric CO2 absorption deviations (filled: H < 10) | |||||||||||||||||||||||
| 0 | 0 |
|
|
|
|
|
|
| IPAIR | NAME | SHIFT | NEWSHIFT | S/N | NAME | SHIFT | NEWSHIFT | S/N |
| 0 | 12240013 | 0.489481 | 0.00000 | 18.7409 | 12240014 | -0.00148596 | 0.490967 | 18.8147 |
| 1 | 12240017 | 0.487201 | 0.00228000 | 18.9676 | 12240018 | -0.00583332 | 0.495314 | 19.0028 |
| 2 | 12240016 | 0.487541 | 0.00194001 | 18.9406 | 12240015 | -0.00141795 | 0.490899 | 18.9217 |
| 3 | 12240012 | 0.489131 | 0.000349998 | 18.3054 | 12240011 | 0.00000 | 0.489481 | 18.3568 |