| Red | Green | Blue | |
| z | 17.64 | ||
| znorm | Inf | ||
| sky | -NaN | -NaN | -NaN |
| S/N | 19.8 | 38.3 | 39.9 |
| S/N(c) | 0.0 | 0.0 | 0.0 |
| SN(E/C) |
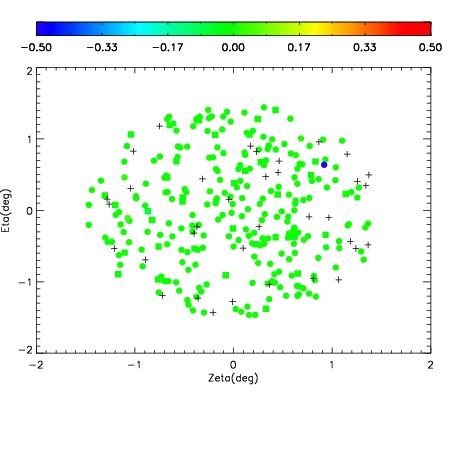
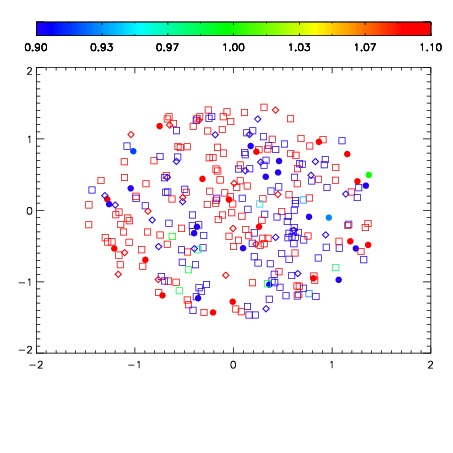
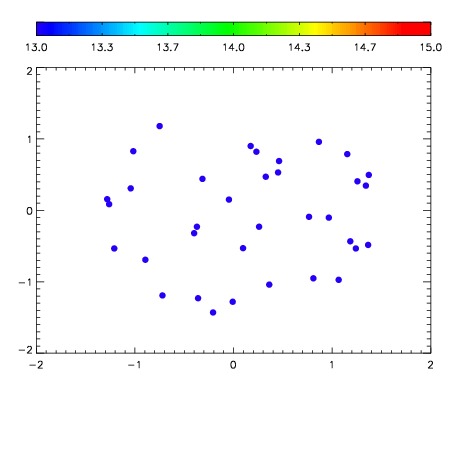

| Frame | Nreads | Zeropoints | Mag plots | Spatial mag deviation | Spatial sky 16325A emission deviations (filled: sky, open: star) | Spatial sky continuum emission | Spatial sky telluric CO2 absorption deviations (filled: H < 10) | |||||||||||||||||||||||
| 0 | 0 |
|
|
|
|
|
|
| IPAIR | NAME | SHIFT | NEWSHIFT | S/N | NAME | SHIFT | NEWSHIFT | S/N |
| 0 | 11110098 | 0.483404 | 0.00000 | 18.0106 | 11110096 | 0.00000 | 0.483404 | 18.1041 |
| 1 | 11110106 | 0.476540 | 0.00686401 | 18.6667 | 11110104 | -0.00467222 | 0.488076 | 18.5582 |
| 2 | 11110109 | 0.477524 | 0.00588000 | 18.4909 | 11110108 | -0.00745840 | 0.490862 | 18.5535 |
| 3 | 11110105 | 0.476468 | 0.00693601 | 18.4310 | 11110107 | -0.00772961 | 0.491134 | 18.5426 |
| 4 | 11110101 | 0.479161 | 0.00424302 | 18.2143 | 11110103 | -0.00501751 | 0.488422 | 18.3790 |
| 5 | 11110102 | 0.478438 | 0.00496602 | 18.1072 | 11110099 | -0.00335492 | 0.486759 | 18.1654 |
| 6 | 11110097 | 0.483105 | 0.000299007 | 18.0636 | 11110100 | -0.00239361 | 0.485798 | 18.1235 |