| Red | Green | Blue | |
| z | 17.64 | ||
| znorm | Inf | ||
| sky | -NaN | -Inf | -NaN |
| S/N | 21.0 | 35.4 | 38.1 |
| S/N(c) | 0.0 | 0.0 | 0.0 |
| SN(E/C) |
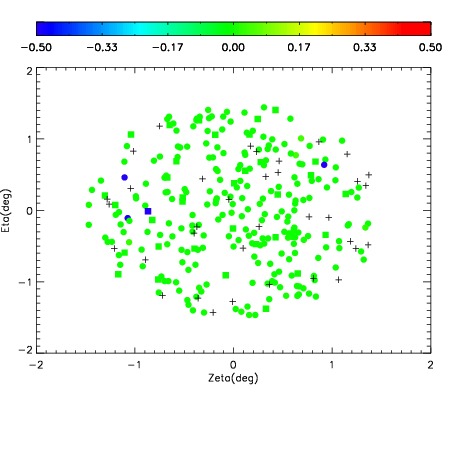


| Frame | Nreads | Zeropoints | Mag plots | Spatial mag deviation | Spatial sky 16325A emission deviations (filled: sky, open: star) | Spatial sky continuum emission | Spatial sky telluric CO2 absorption deviations (filled: H < 10) | |||||||||||||||||||||||
| 0 | 0 |
|
|
|
|
|
|
| IPAIR | NAME | SHIFT | NEWSHIFT | S/N | NAME | SHIFT | NEWSHIFT | S/N |
| 0 | 11420055 | 0.479645 | 0.00000 | 18.1079 | 11420053 | 0.00000 | 0.479645 | 18.3121 |
| 1 | 11420059 | 0.478427 | 0.00121802 | 18.9267 | 11420056 | -0.00190318 | 0.481548 | 18.9273 |
| 2 | 11420058 | 0.477955 | 0.00169000 | 18.8829 | 11420060 | -0.00498483 | 0.484630 | 18.9239 |
| 3 | 11420054 | 0.479313 | 0.000332028 | 18.7072 | 11420057 | -0.00255389 | 0.482199 | 18.9081 |