| Red | Green | Blue | |
| z | 17.64 | ||
| znorm | Inf | ||
| sky | -NaN | -Inf | -NaN |
| S/N | 21.8 | 38.5 | 41.7 |
| S/N(c) | 0.0 | 0.0 | 0.0 |
| SN(E/C) |
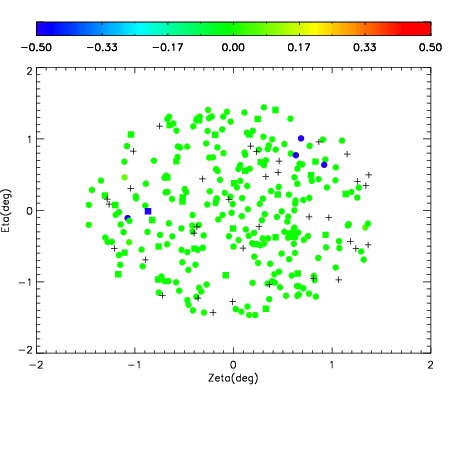
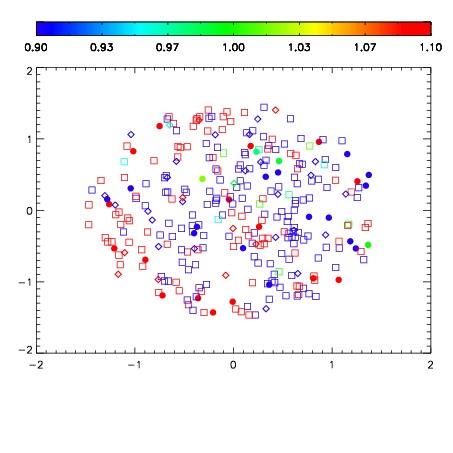
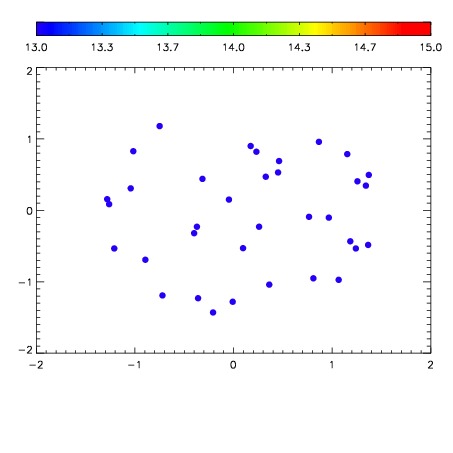

| Frame | Nreads | Zeropoints | Mag plots | Spatial mag deviation | Spatial sky 16325A emission deviations (filled: sky, open: star) | Spatial sky continuum emission | Spatial sky telluric CO2 absorption deviations (filled: H < 10) | |||||||||||||||||||||||
| 0 | 0 |
|
|
|
|
|
|
| IPAIR | NAME | SHIFT | NEWSHIFT | S/N | NAME | SHIFT | NEWSHIFT | S/N |
| 0 | 11640063 | 0.490883 | 0.00000 | 18.8878 | 11640068 | -0.00290894 | 0.493792 | 18.8410 |
| 1 | 11640067 | 0.489566 | 0.00131699 | 18.9142 | 11640065 | -0.00173804 | 0.492621 | 18.8519 |
| 2 | 11640066 | 0.489856 | 0.00102699 | 18.9104 | 11640064 | -0.00277611 | 0.493659 | 18.8487 |
| 3 | 11640062 | 0.489943 | 0.000939995 | 18.8585 | 11640061 | 0.00000 | 0.490883 | 18.6361 |