| Red | Green | Blue | |
| z | 17.64 | ||
| znorm | Inf | ||
| sky | -NaN | -Inf | -Inf |
| S/N | 32.5 | 57.5 | 59.9 |
| S/N(c) | 0.0 | 0.0 | 0.0 |
| SN(E/C) |
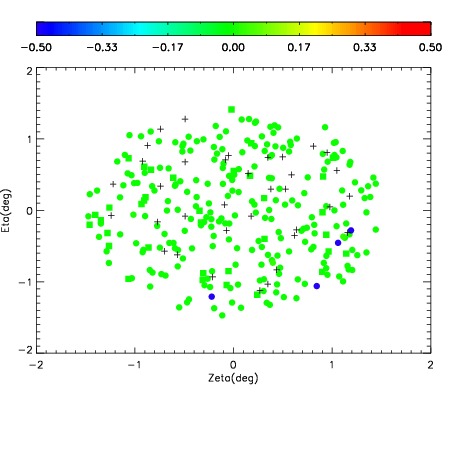
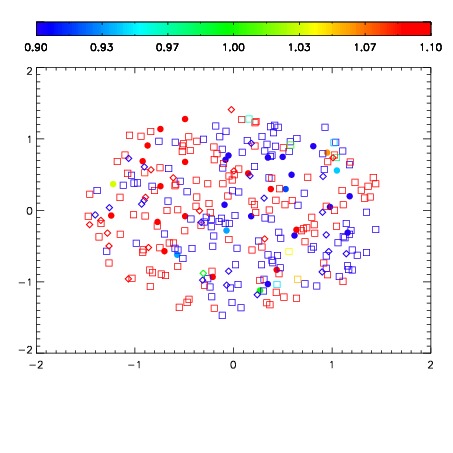
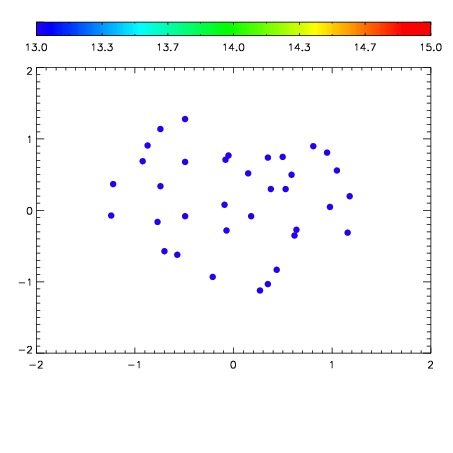

| Frame | Nreads | Zeropoints | Mag plots | Spatial mag deviation | Spatial sky 16325A emission deviations (filled: sky, open: star) | Spatial sky continuum emission | Spatial sky telluric CO2 absorption deviations (filled: H < 10) | |||||||||||||||||||||||
| 0 | 0 |
|
|
|
|
|
|
| IPAIR | NAME | SHIFT | NEWSHIFT | S/N | NAME | SHIFT | NEWSHIFT | S/N |
| 0 | 11140100 | 0.485583 | 0.00000 | 19.0814 | 11140101 | 0.000248536 | 0.485334 | 19.1326 |
| 1 | 11140107 | 0.481325 | 0.00425801 | 19.1619 | 11140106 | -0.00257369 | 0.488157 | 19.1707 |
| 2 | 11140104 | 0.483951 | 0.00163200 | 19.1544 | 11140105 | -0.00284856 | 0.488432 | 19.1540 |
| 3 | 11140108 | 0.482116 | 0.00346699 | 19.1495 | 11140109 | -0.00236516 | 0.487948 | 19.1419 |
| 4 | 11140103 | 0.483460 | 0.00212300 | 19.1376 | 11140102 | 0.00100156 | 0.484581 | 19.1363 |
| 5 | 11140099 | 0.484935 | 0.000648022 | 19.0599 | 11140098 | 0.00000 | 0.485583 | 19.0419 |