| Red | Green | Blue | |
| z | 17.64 | ||
| znorm | Inf | ||
| sky | -Inf | -NaN | -NaN |
| S/N | 25.8 | 45.6 | 48.3 |
| S/N(c) | 0.0 | 0.0 | 0.0 |
| SN(E/C) |
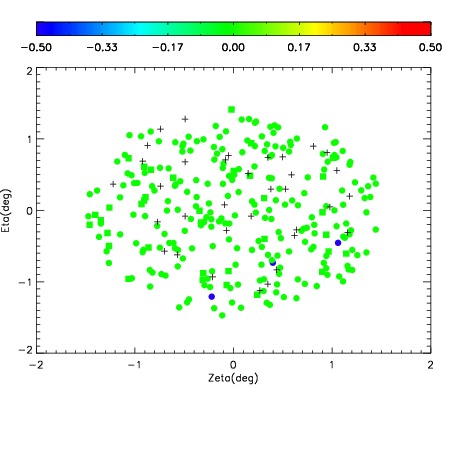
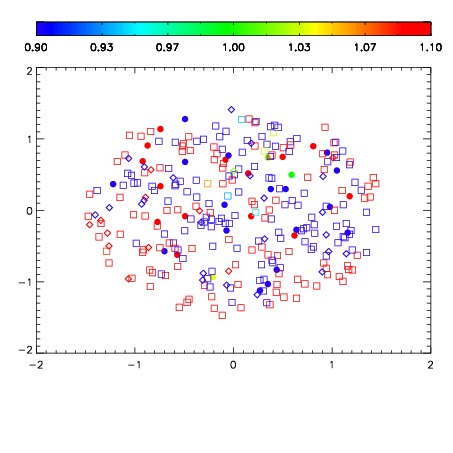
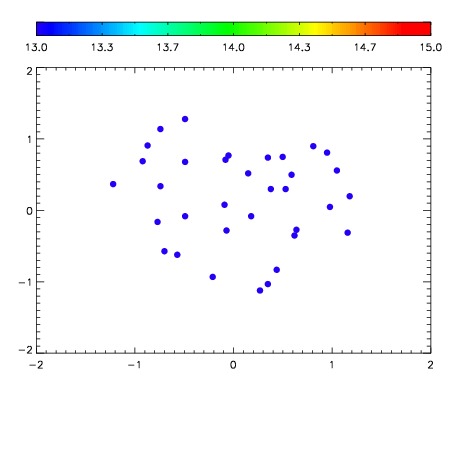

| Frame | Nreads | Zeropoints | Mag plots | Spatial mag deviation | Spatial sky 16325A emission deviations (filled: sky, open: star) | Spatial sky continuum emission | Spatial sky telluric CO2 absorption deviations (filled: H < 10) | |||||||||||||||||||||||
| 0 | 0 |
|
|
|
|
|
|
| IPAIR | NAME | SHIFT | NEWSHIFT | S/N | NAME | SHIFT | NEWSHIFT | S/N |
| 0 | 11370022 | 0.477664 | 0.00000 | 18.9637 | 11370027 | -0.000721093 | 0.478385 | 18.8815 |
| 1 | 11370025 | 0.476657 | 0.00100699 | 19.0124 | 11370024 | -0.00241405 | 0.480078 | 19.0539 |
| 2 | 11370026 | 0.477544 | 0.000119984 | 18.9924 | 11370023 | -0.00243165 | 0.480096 | 19.0498 |
| 3 | 11370021 | 0.477485 | 0.000178993 | 18.9685 | 11370020 | 0.00000 | 0.477664 | 18.9020 |