| Red | Green | Blue | |
| z | 17.64 | ||
| znorm | Inf | ||
| sky | -Inf | -Inf | -Inf |
| S/N | 22.1 | 37.8 | 42.7 |
| S/N(c) | 0.0 | 0.0 | 0.0 |
| SN(E/C) |
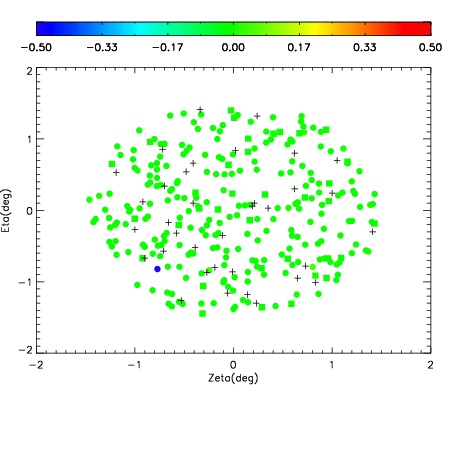
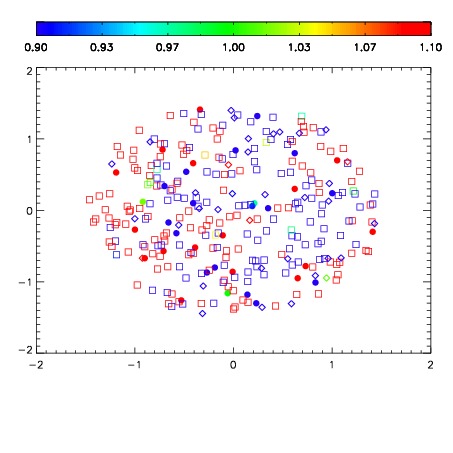


| Frame | Nreads | Zeropoints | Mag plots | Spatial mag deviation | Spatial sky 16325A emission deviations (filled: sky, open: star) | Spatial sky continuum emission | Spatial sky telluric CO2 absorption deviations (filled: H < 10) | |||||||||||||||||||||||
| 0 | 0 |
|
|
|
|
|
|
| IPAIR | NAME | SHIFT | NEWSHIFT | S/N | NAME | SHIFT | NEWSHIFT | S/N |
| 0 | 11670075 | 0.489493 | 0.00000 | 18.8204 | 11670080 | -0.00247753 | 0.491971 | 18.8659 |
| 1 | 11670079 | 0.489392 | 0.000101000 | 18.9163 | 11670073 | 0.00000 | 0.489493 | 18.8763 |
| 2 | 11670074 | 0.488929 | 0.000564009 | 18.8117 | 11670076 | -0.00381643 | 0.493309 | 18.8562 |
| 3 | 11670078 | 0.489298 | 0.000195026 | 18.7459 | 11670077 | -0.00380479 | 0.493298 | 18.8437 |