| Red | Green | Blue | |
| z | 17.64 | ||
| znorm | Inf | ||
| sky | -Inf | -Inf | -NaN |
| S/N | 11.8 | 22.7 | 23.2 |
| S/N(c) | 0.0 | 0.0 | 0.0 |
| SN(E/C) |
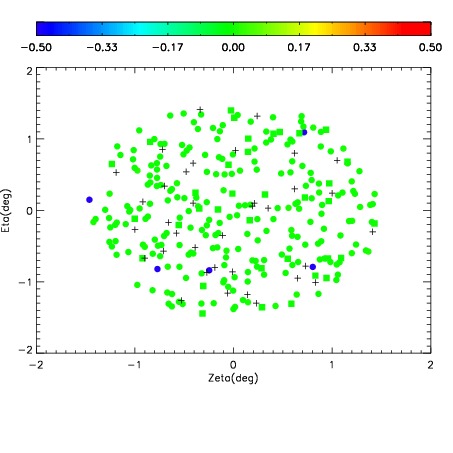
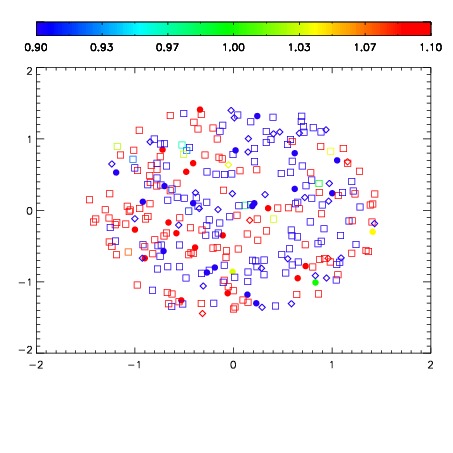
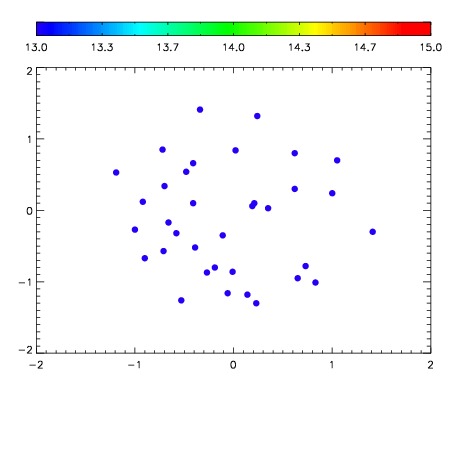

| Frame | Nreads | Zeropoints | Mag plots | Spatial mag deviation | Spatial sky 16325A emission deviations (filled: sky, open: star) | Spatial sky continuum emission | Spatial sky telluric CO2 absorption deviations (filled: H < 10) | |||||||||||||||||||||||
| 0 | 0 |
|
|
|
|
|
|
| IPAIR | NAME | SHIFT | NEWSHIFT | S/N | NAME | SHIFT | NEWSHIFT | S/N |
| 0 | 11760026 | 0.496634 | 0.00000 | 17.9944 | 11760025 | -0.000542872 | 0.497177 | 18.0546 |
| 1 | 11760027 | 0.496009 | 0.000625014 | 18.1826 | 11760028 | -0.00208023 | 0.498714 | 18.0674 |
| 2 | 11760022 | 0.494946 | 0.00168800 | 17.9877 | 11760024 | -0.000419352 | 0.497053 | 17.8982 |
| 3 | 11760023 | 0.494876 | 0.00175801 | 17.9388 | 11760021 | 0.00000 | 0.496634 | 17.7483 |