| Red | Green | Blue | |
| z | 17.64 | ||
| znorm | Inf | ||
| sky | -Inf | -Inf | -Inf |
| S/N | 28.9 | 48.9 | 53.1 |
| S/N(c) | 0.0 | 0.0 | 0.0 |
| SN(E/C) |
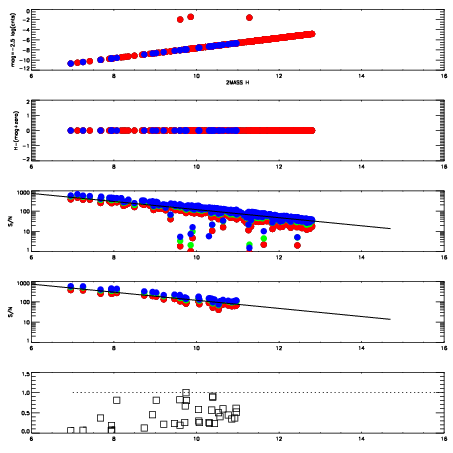


| Frame | Nreads | Zeropoints | Mag plots | Spatial mag deviation | Spatial sky 16325A emission deviations (filled: sky, open: star) | Spatial sky continuum emission | Spatial sky telluric CO2 absorption deviations (filled: H < 10) | |||||||||||||||||||||||
| 0 | 0 |
|
|
|
|
|
|
| IPAIR | NAME | SHIFT | NEWSHIFT | S/N | NAME | SHIFT | NEWSHIFT | S/N |
| 0 | 04860015 | 0.495078 | 0.00000 | 19.0965 | 04860017 | 0.00123068 | 0.493847 | 19.1072 |
| 1 | 04860014 | 0.492107 | 0.00297099 | 19.0930 | 04860020 | 0.00111097 | 0.493967 | 19.0920 |
| 2 | 04860018 | 0.492764 | 0.00231400 | 19.0763 | 04860013 | 0.00000 | 0.495078 | 19.0671 |
| 3 | 04860019 | 0.494154 | 0.000923991 | 19.0686 | 04860016 | 0.00365393 | 0.491424 | 19.0491 |