| Red | Green | Blue | |
| z | 17.63 | ||
| znorm | Inf | ||
| sky | -NaN | -NaN | -Inf |
| S/N | 28.1 | 48.1 | 51.5 |
| S/N(c) | 0.0 | 0.0 | 0.0 |
| SN(E/C) |
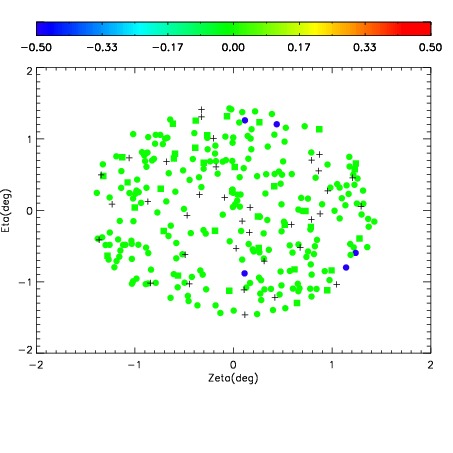
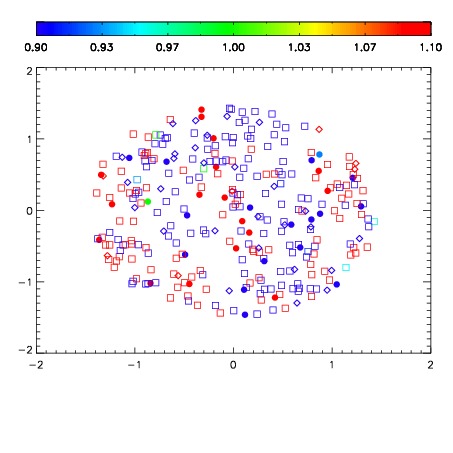
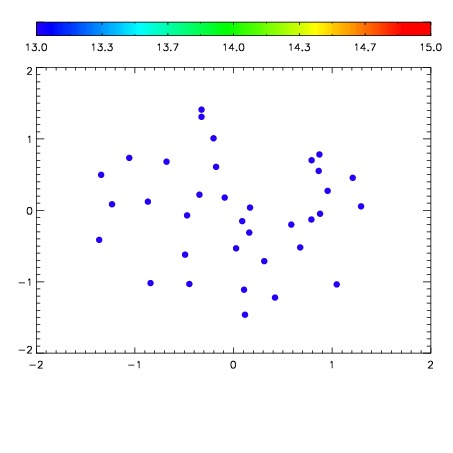

| Frame | Nreads | Zeropoints | Mag plots | Spatial mag deviation | Spatial sky 16325A emission deviations (filled: sky, open: star) | Spatial sky continuum emission | Spatial sky telluric CO2 absorption deviations (filled: H < 10) | |||||||||||||||||||||||
| 0 | 0 |
|
|
|
|
|
|
| IPAIR | NAME | SHIFT | NEWSHIFT | S/N | NAME | SHIFT | NEWSHIFT | S/N |
| 0 | 04900016 | 0.489221 | 0.00000 | 19.0728 | 04900017 | 0.00611407 | 0.483107 | 18.9056 |
| 1 | 04900012 | 0.488312 | 0.000909001 | 19.1877 | 04900013 | 0.00209916 | 0.487122 | 19.1987 |
| 2 | 04900011 | 0.487370 | 0.00185099 | 19.1834 | 04900010 | 0.00000 | 0.489221 | 19.1715 |
| 3 | 04900015 | 0.488428 | 0.000793010 | 19.1016 | 04900014 | 0.00309544 | 0.486126 | 19.1635 |