| Red | Green | Blue | |
| z | 17.64 | ||
| znorm | Inf | ||
| sky | -NaN | -Inf | -Inf |
| S/N | 20.6 | 38.8 | 40.8 |
| S/N(c) | 0.0 | 0.0 | 0.0 |
| SN(E/C) |
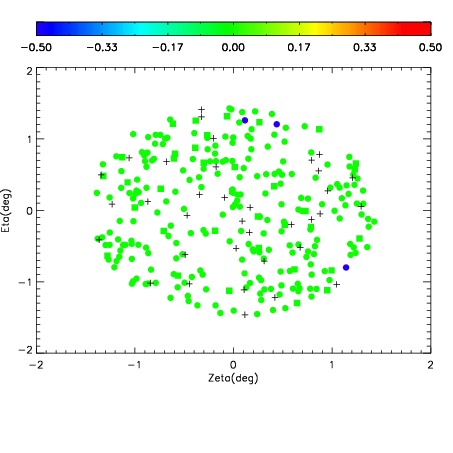
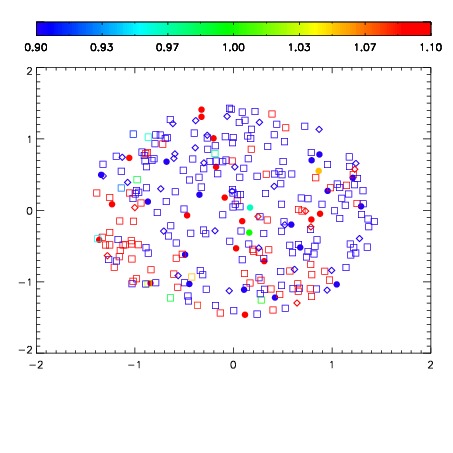


| Frame | Nreads | Zeropoints | Mag plots | Spatial mag deviation | Spatial sky 16325A emission deviations (filled: sky, open: star) | Spatial sky continuum emission | Spatial sky telluric CO2 absorption deviations (filled: H < 10) | |||||||||||||||||||||||
| 0 | 0 |
|
|
|
|
|
|
| IPAIR | NAME | SHIFT | NEWSHIFT | S/N | NAME | SHIFT | NEWSHIFT | S/N |
| 0 | 07890049 | 0.472524 | 0.00000 | 18.3628 | 07890048 | 0.00000 | 0.472524 | 18.3332 |
| 1 | 07890053 | 0.472173 | 0.000350982 | 18.8684 | 07890052 | -0.000572058 | 0.473096 | 18.8448 |
| 2 | 07890054 | 0.472317 | 0.000206977 | 18.8581 | 07890051 | 0.000357440 | 0.472167 | 18.7965 |
| 3 | 07890050 | 0.472204 | 0.000319988 | 18.6178 | 07890055 | 0.00251508 | 0.470009 | 18.7837 |