| Red | Green | Blue | |
| z | 17.64 | ||
| znorm | Inf | ||
| sky | -Inf | -Inf | -Inf |
| S/N | 32.0 | 55.0 | 62.4 |
| S/N(c) | 0.0 | 0.0 | 0.0 |
| SN(E/C) |
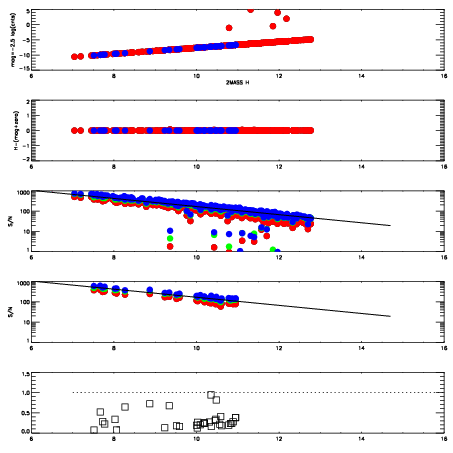
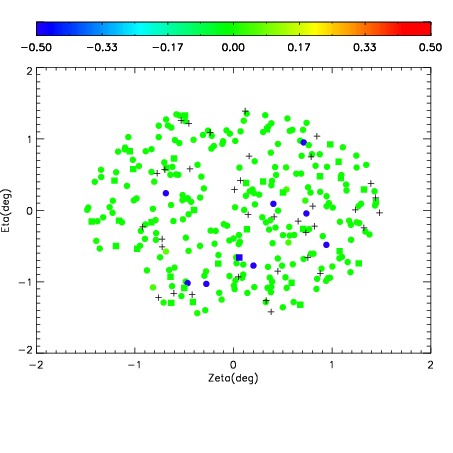
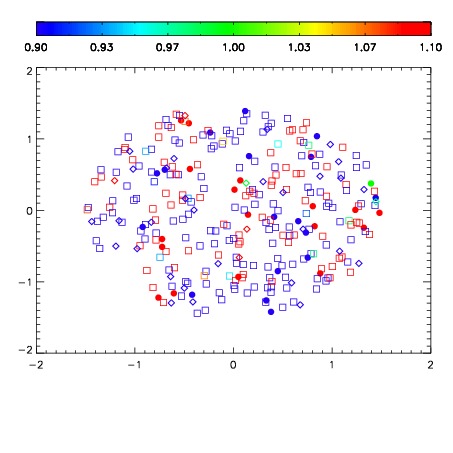
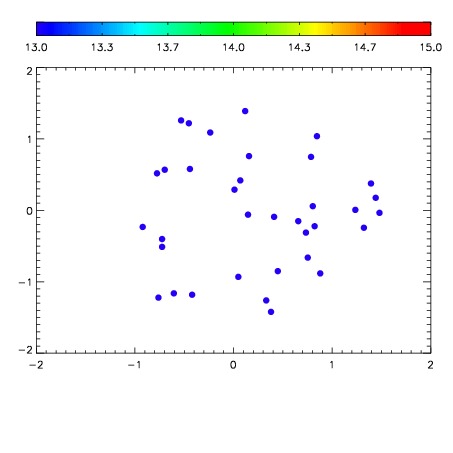

| Frame | Nreads | Zeropoints | Mag plots | Spatial mag deviation | Spatial sky 16325A emission deviations (filled: sky, open: star) | Spatial sky continuum emission | Spatial sky telluric CO2 absorption deviations (filled: H < 10) | |||||||||||||||||||||||
| 0 | 0 |
|
|
|
|
|
|
| IPAIR | NAME | SHIFT | NEWSHIFT | S/N | NAME | SHIFT | NEWSHIFT | S/N |
| 0 | 11130098 | 0.485268 | 0.00000 | 18.9530 | 11130100 | -7.17833e-05 | 0.485340 | 18.9083 |
| 1 | 11130097 | 0.484202 | 0.00106600 | 18.9773 | 11130099 | -0.000158058 | 0.485426 | 18.9315 |
| 2 | 11130102 | 0.484069 | 0.00119901 | 18.9595 | 11130103 | -0.00214209 | 0.487410 | 18.9196 |
| 3 | 11130106 | 0.483781 | 0.00148699 | 18.9155 | 11130107 | -0.00103426 | 0.486302 | 18.9056 |
| 4 | 11130101 | 0.483782 | 0.00148600 | 18.9056 | 11130096 | 0.00000 | 0.485268 | 18.8729 |
| 5 | 11130110 | 0.483840 | 0.00142801 | 18.8249 | 11130108 | -0.00124595 | 0.486514 | 18.8709 |
| 6 | 11130105 | 0.482905 | 0.00236300 | 18.8207 | 11130104 | -0.00184968 | 0.487118 | 18.8199 |
| 7 | 11130109 | 0.483188 | 0.00207999 | 18.8003 | 11130111 | -0.00141734 | 0.486685 | 18.7594 |