| Red | Green | Blue | |
| z | 17.64 | ||
| znorm | Inf | ||
| sky | -Inf | -NaN | -NaN |
| S/N | 25.8 | 46.1 | 49.5 |
| S/N(c) | 0.0 | 0.0 | 0.0 |
| SN(E/C) |
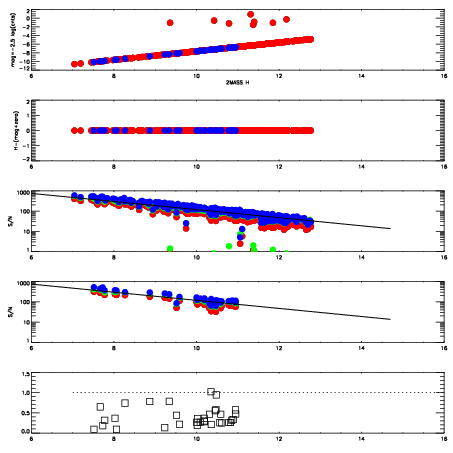
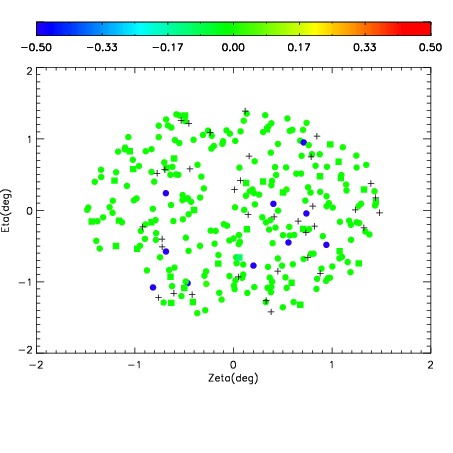
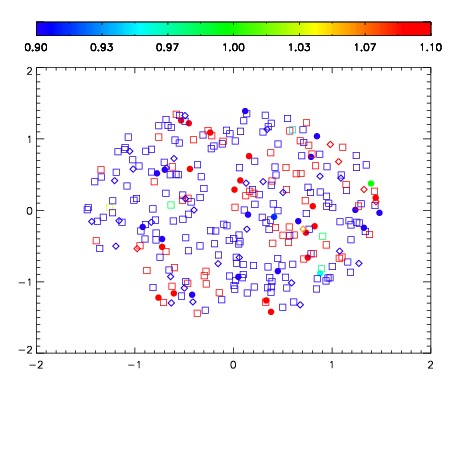
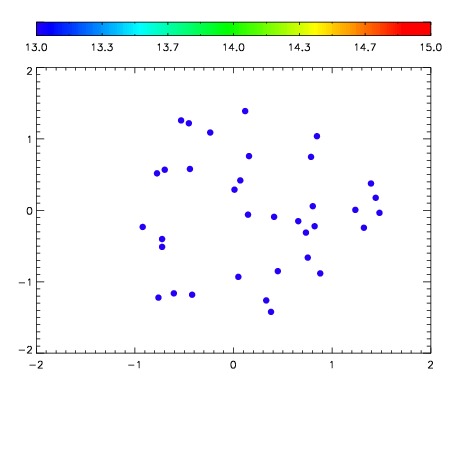

| Frame | Nreads | Zeropoints | Mag plots | Spatial mag deviation | Spatial sky 16325A emission deviations (filled: sky, open: star) | Spatial sky continuum emission | Spatial sky telluric CO2 absorption deviations (filled: H < 10) | |||||||||||||||||||||||
| 0 | 0 |
|
|
|
|
|
|
| IPAIR | NAME | SHIFT | NEWSHIFT | S/N | NAME | SHIFT | NEWSHIFT | S/N |
| 0 | 11470028 | 0.479329 | 0.00000 | 19.0195 | 11470025 | -0.00187329 | 0.481202 | 18.9681 |
| 1 | 11470027 | 0.477825 | 0.00150400 | 19.0239 | 11470029 | 0.000477785 | 0.478851 | 18.9873 |
| 2 | 11470024 | 0.476294 | 0.00303498 | 18.9939 | 11470026 | -0.00213001 | 0.481459 | 18.9481 |
| 3 | 11470023 | 0.475303 | 0.00402600 | 18.9770 | 11470022 | 0.00000 | 0.479329 | 18.9366 |