| Red | Green | Blue | |
| z | 17.64 | ||
| znorm | Inf | ||
| sky | -NaN | -NaN | -NaN |
| S/N | 27.9 | 48.2 | 51.1 |
| S/N(c) | 0.0 | 0.0 | 0.0 |
| SN(E/C) |
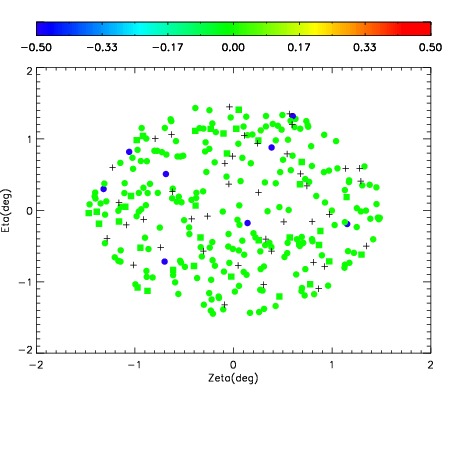
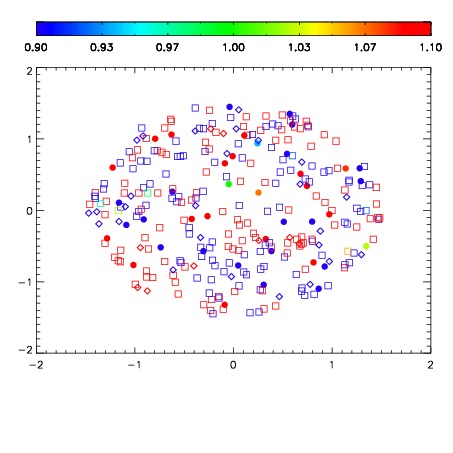
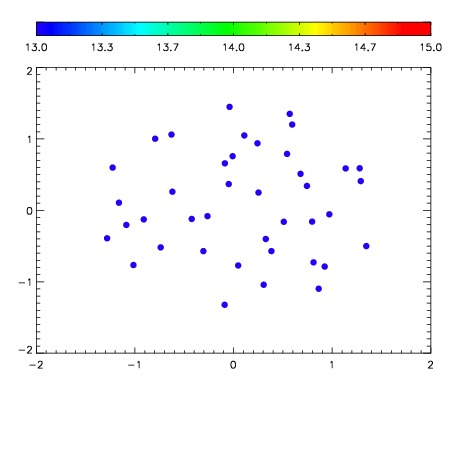

| Frame | Nreads | Zeropoints | Mag plots | Spatial mag deviation | Spatial sky 16325A emission deviations (filled: sky, open: star) | Spatial sky continuum emission | Spatial sky telluric CO2 absorption deviations (filled: H < 10) | |||||||||||||||||||||||
| 0 | 0 |
|
|
|
|
|
|
| IPAIR | NAME | SHIFT | NEWSHIFT | S/N | NAME | SHIFT | NEWSHIFT | S/N |
| 0 | 08470051 | 0.486690 | 0.00000 | 19.0513 | 08470045 | 0.00000 | 0.486690 | 19.0565 |
| 1 | 08470046 | 0.483584 | 0.00310603 | 19.0602 | 08470049 | 0.00156790 | 0.485122 | 19.0711 |
| 2 | 08470050 | 0.485540 | 0.00115001 | 19.0471 | 08470052 | 0.00170742 | 0.484983 | 19.0524 |
| 3 | 08470047 | 0.485321 | 0.00136903 | 19.0096 | 08470048 | 0.00352614 | 0.483164 | 19.0376 |