| Red | Green | Blue | |
| z | 17.64 | ||
| znorm | Inf | ||
| sky | -NaN | -NaN | -Inf |
| S/N | 28.6 | 50.1 | 52.9 |
| S/N(c) | 0.0 | 0.0 | 0.0 |
| SN(E/C) |
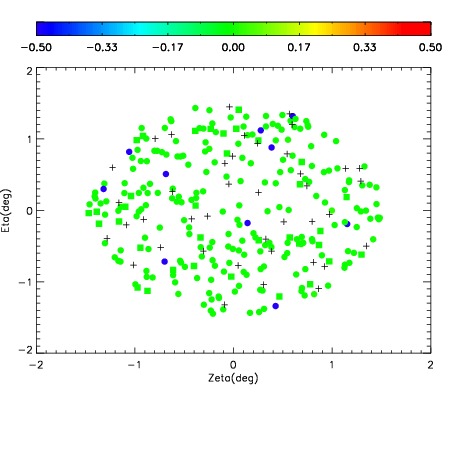
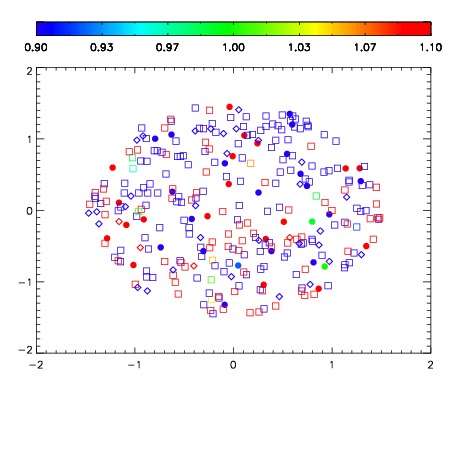


| Frame | Nreads | Zeropoints | Mag plots | Spatial mag deviation | Spatial sky 16325A emission deviations (filled: sky, open: star) | Spatial sky continuum emission | Spatial sky telluric CO2 absorption deviations (filled: H < 10) | |||||||||||||||||||||||
| 0 | 0 |
|
|
|
|
|
|
| IPAIR | NAME | SHIFT | NEWSHIFT | S/N | NAME | SHIFT | NEWSHIFT | S/N |
| 0 | 11940038 | 0.498591 | 0.00000 | 19.0961 | 11940041 | -0.00467846 | 0.503269 | 19.0761 |
| 1 | 11940043 | 0.496000 | 0.00259101 | 19.1398 | 11940044 | -0.00535916 | 0.503950 | 19.1207 |
| 2 | 11940042 | 0.495905 | 0.00268599 | 19.0993 | 11940037 | 0.00000 | 0.498591 | 19.0818 |
| 3 | 11940039 | 0.498192 | 0.000398993 | 19.0919 | 11940040 | -0.00352096 | 0.502112 | 19.0756 |