| Red | Green | Blue | |
| z | 17.63 | ||
| znorm | Inf | ||
| sky | -NaN | -NaN | -NaN |
| S/N | 27.7 | 47.9 | 49.8 |
| S/N(c) | 0.0 | 0.0 | 0.0 |
| SN(E/C) |
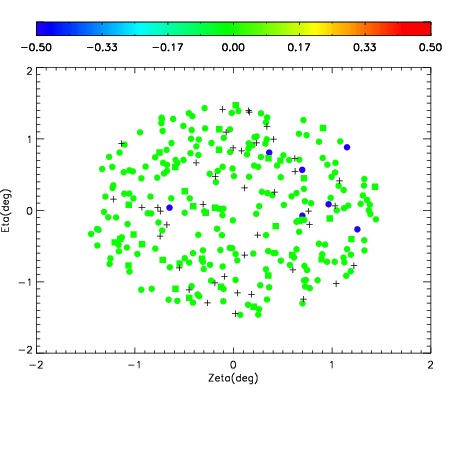
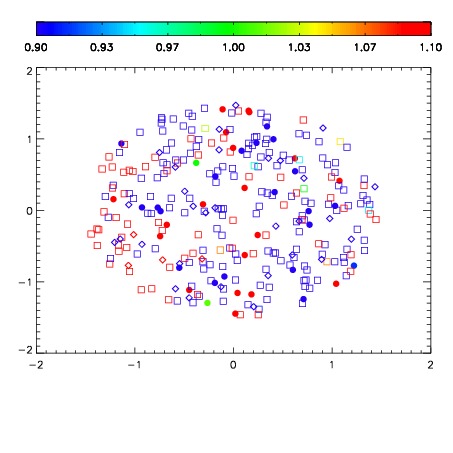


| Frame | Nreads | Zeropoints | Mag plots | Spatial mag deviation | Spatial sky 16325A emission deviations (filled: sky, open: star) | Spatial sky continuum emission | Spatial sky telluric CO2 absorption deviations (filled: H < 10) | |||||||||||||||||||||||
| 0 | 0 |
|
|
|
|
|
|
| IPAIR | NAME | SHIFT | NEWSHIFT | S/N | NAME | SHIFT | NEWSHIFT | S/N |
| 0 | 04370031 | 0.491723 | 0.00000 | 19.1790 | 04370032 | 0.000466943 | 0.491256 | 19.1797 |
| 1 | 04370026 | 0.490422 | 0.00130099 | 19.1703 | 04370025 | 0.00000 | 0.491723 | 19.1587 |
| 2 | 04370027 | 0.491494 | 0.000229001 | 19.1623 | 04370028 | 0.000974016 | 0.490749 | 19.1553 |
| 3 | 04370030 | 0.489965 | 0.00175801 | 19.1578 | 04370029 | -0.00109676 | 0.492820 | 19.1519 |