| Red | Green | Blue | |
| z | 17.64 | ||
| znorm | Inf | ||
| sky | -NaN | -NaN | -Inf |
| S/N | 27.5 | 47.7 | 52.7 |
| S/N(c) | 0.0 | 0.0 | 0.0 |
| SN(E/C) |
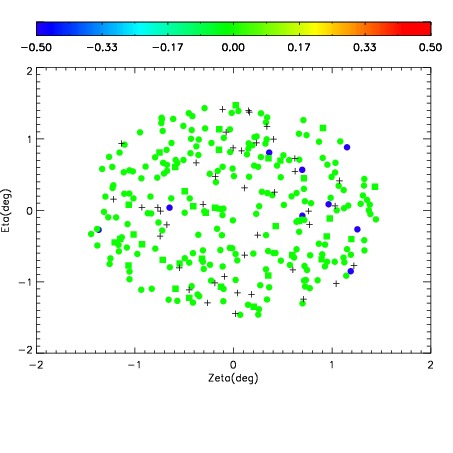
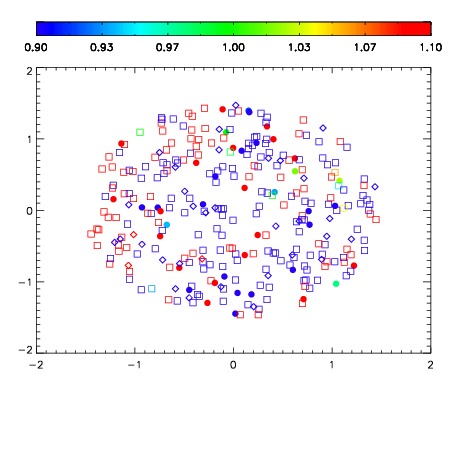
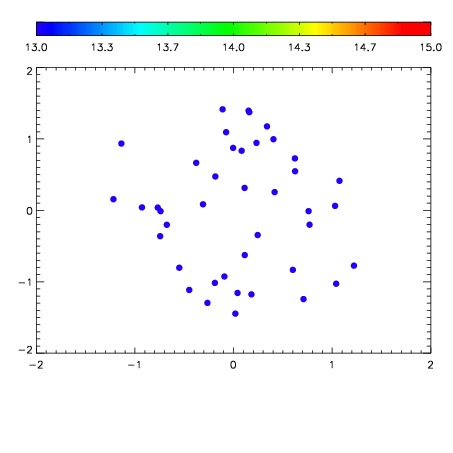

| Frame | Nreads | Zeropoints | Mag plots | Spatial mag deviation | Spatial sky 16325A emission deviations (filled: sky, open: star) | Spatial sky continuum emission | Spatial sky telluric CO2 absorption deviations (filled: H < 10) | |||||||||||||||||||||||
| 0 | 0 |
|
|
|
|
|
|
| IPAIR | NAME | SHIFT | NEWSHIFT | S/N | NAME | SHIFT | NEWSHIFT | S/N |
| 0 | 04560064 | 0.498811 | 0.00000 | 19.1723 | 04560062 | -0.00302990 | 0.501841 | 19.1775 |
| 1 | 04560059 | 0.498516 | 0.000295013 | 19.1699 | 04560061 | 5.31127e-05 | 0.498758 | 19.1669 |
| 2 | 04560063 | 0.498139 | 0.000672013 | 19.1685 | 04560065 | -0.00249316 | 0.501304 | 19.1602 |
| 3 | 04560060 | 0.498718 | 9.30130e-05 | 19.1616 | 04560058 | 0.00000 | 0.498811 | 19.1438 |