| Red | Green | Blue | |
| z | 17.64 | ||
| znorm | Inf | ||
| sky | -NaN | -NaN | -Inf |
| S/N | 18.4 | 34.5 | 37.9 |
| S/N(c) | 0.0 | 0.0 | 0.0 |
| SN(E/C) |
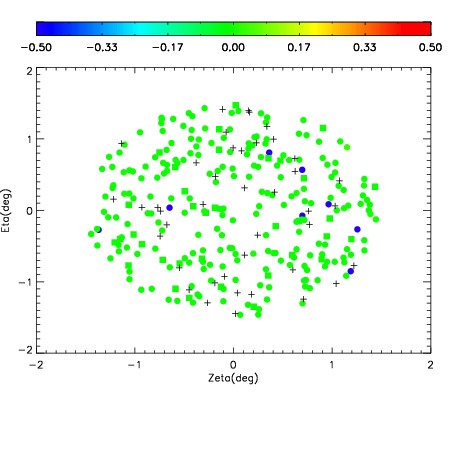
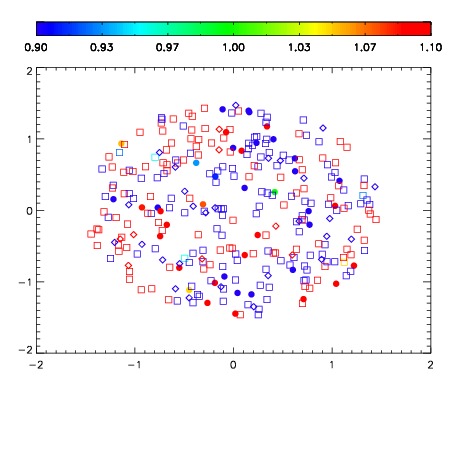
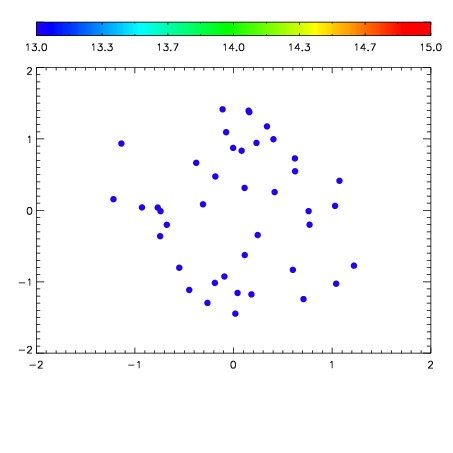

| Frame | Nreads | Zeropoints | Mag plots | Spatial mag deviation | Spatial sky 16325A emission deviations (filled: sky, open: star) | Spatial sky continuum emission | Spatial sky telluric CO2 absorption deviations (filled: H < 10) | |||||||||||||||||||||||
| 0 | 0 |
|
|
|
|
|
|
| IPAIR | NAME | SHIFT | NEWSHIFT | S/N | NAME | SHIFT | NEWSHIFT | S/N |
| 0 | 07830088 | 0.472051 | 0.00000 | 18.6648 | 07830082 | 0.00000 | 0.472051 | 18.6726 |
| 1 | 07830084 | 0.470826 | 0.00122499 | 18.6515 | 07830086 | -0.000938015 | 0.472989 | 18.6609 |
| 2 | 07830087 | 0.471353 | 0.000698000 | 18.6498 | 07830089 | 0.00162346 | 0.470428 | 18.6195 |
| 3 | 07830083 | 0.470939 | 0.00111198 | 18.5758 | 07830085 | -0.000580885 | 0.472632 | 18.6128 |