| Red | Green | Blue | |
| z | 17.64 | ||
| znorm | Inf | ||
| sky | -Inf | -Inf | -Inf |
| S/N | 22.4 | 39.6 | 41.8 |
| S/N(c) | 0.0 | 0.0 | 0.0 |
| SN(E/C) |
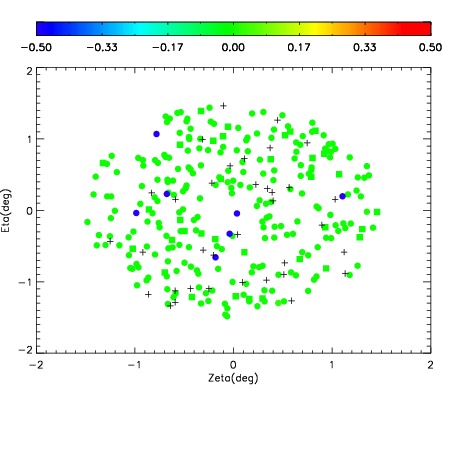
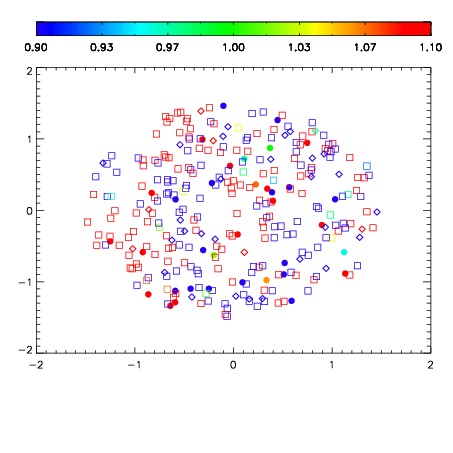
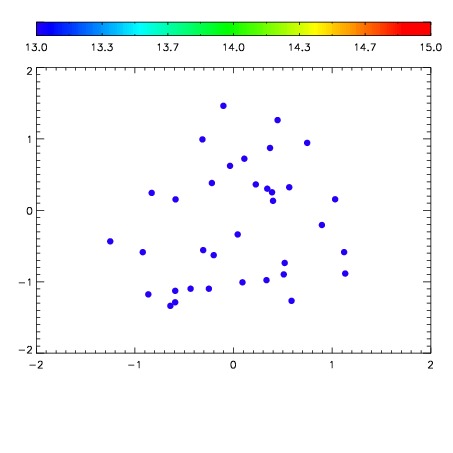

| Frame | Nreads | Zeropoints | Mag plots | Spatial mag deviation | Spatial sky 16325A emission deviations (filled: sky, open: star) | Spatial sky continuum emission | Spatial sky telluric CO2 absorption deviations (filled: H < 10) | |||||||||||||||||||||||
| 0 | 0 |
|
|
|
|
|
|
| IPAIR | NAME | SHIFT | NEWSHIFT | S/N | NAME | SHIFT | NEWSHIFT | S/N |
| 0 | 11400076 | 0.475110 | 0.00000 | 18.6860 | 11400077 | 0.000644977 | 0.474465 | 18.6063 |
| 1 | 11400075 | 0.474479 | 0.000631005 | 18.8089 | 11400074 | 0.00000 | 0.475110 | 18.8258 |
| 2 | 11400080 | 0.474741 | 0.000368983 | 18.7956 | 11400081 | 0.000759535 | 0.474350 | 18.7353 |
| 3 | 11400079 | 0.474952 | 0.000157982 | 18.7339 | 11400078 | 0.00158649 | 0.473523 | 18.6554 |