| Red | Green | Blue | |
| z | 17.64 | ||
| znorm | Inf | ||
| sky | -NaN | -Inf | -Inf |
| S/N | 23.8 | 42.5 | 45.1 |
| S/N(c) | 0.0 | 0.0 | 0.0 |
| SN(E/C) |

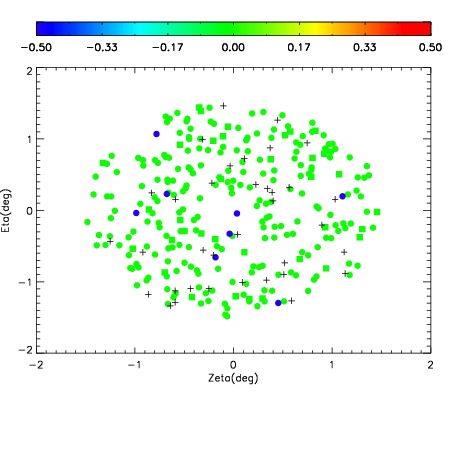
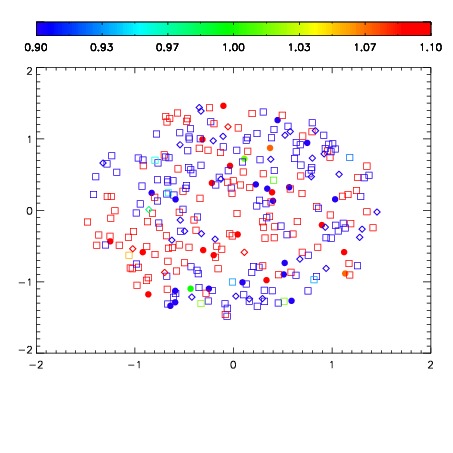
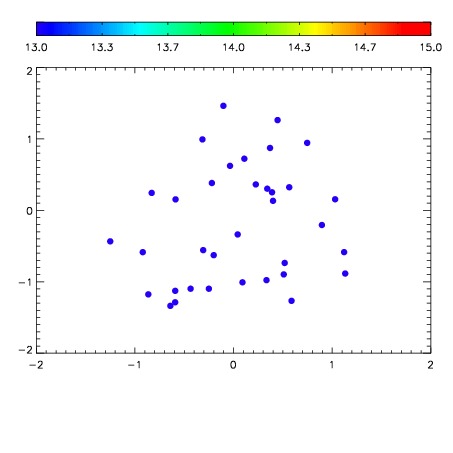

| Frame | Nreads | Zeropoints | Mag plots | Spatial mag deviation | Spatial sky 16325A emission deviations (filled: sky, open: star) | Spatial sky continuum emission | Spatial sky telluric CO2 absorption deviations (filled: H < 10) | |||||||||||||||||||||||
| 0 | 0 |
|
|
|
|
|
|
| IPAIR | NAME | SHIFT | NEWSHIFT | S/N | NAME | SHIFT | NEWSHIFT | S/N |
| 0 | 11710061 | 0.485921 | 0.00000 | 18.9204 | 11710062 | -0.00359625 | 0.489517 | 18.9265 |
| 1 | 11710065 | 0.484321 | 0.00160000 | 18.9378 | 11710066 | -0.00512770 | 0.491049 | 18.9905 |
| 2 | 11710064 | 0.483407 | 0.00251400 | 18.8893 | 11710063 | -0.00459841 | 0.490519 | 18.9258 |
| 3 | 11710060 | 0.485690 | 0.000230998 | 18.7986 | 11710059 | 0.00000 | 0.485921 | 18.7135 |