| Red | Green | Blue | |
| z | 17.64 | ||
| znorm | Inf | ||
| sky | -Inf | -Inf | -NaN |
| S/N | 29.5 | 49.5 | 51.7 |
| S/N(c) | 0.0 | 0.0 | 0.0 |
| SN(E/C) |
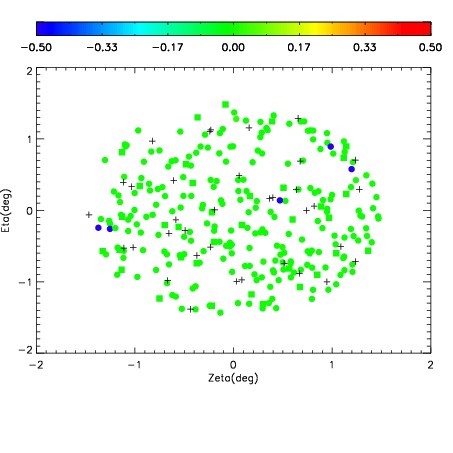
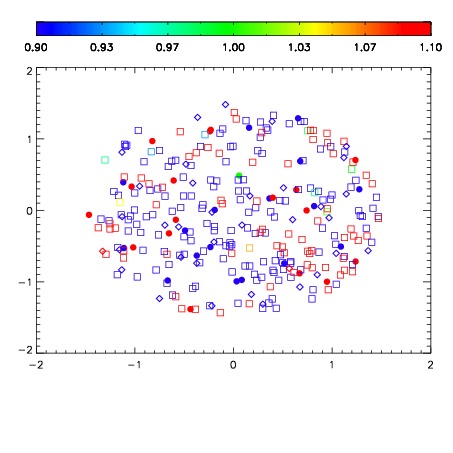
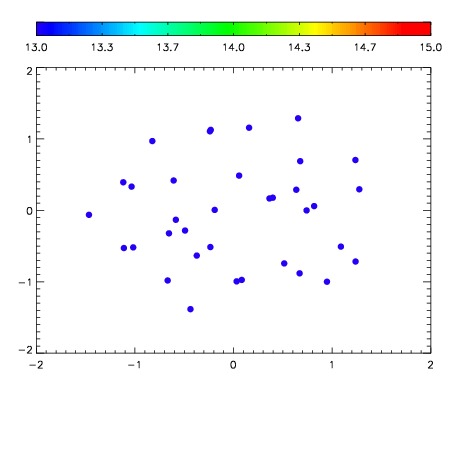

| Frame | Nreads | Zeropoints | Mag plots | Spatial mag deviation | Spatial sky 16325A emission deviations (filled: sky, open: star) | Spatial sky continuum emission | Spatial sky telluric CO2 absorption deviations (filled: H < 10) | |||||||||||||||||||||||
| 0 | 0 |
|
|
|
|
|
|
| IPAIR | NAME | SHIFT | NEWSHIFT | S/N | NAME | SHIFT | NEWSHIFT | S/N |
| 0 | 11940076 | 0.496945 | 0.00000 | 19.1789 | 11940070 | 0.00000 | 0.496945 | 19.1661 |
| 1 | 11940072 | 0.495004 | 0.00194100 | 19.2118 | 11940074 | -0.00285016 | 0.499795 | 19.2216 |
| 2 | 11940071 | 0.494790 | 0.00215501 | 19.2067 | 11940073 | -0.00343893 | 0.500384 | 19.2144 |
| 3 | 11940075 | 0.495934 | 0.00101098 | 19.1963 | 11940077 | -0.00335942 | 0.500304 | 19.1983 |