| Red | Green | Blue | |
| z | 17.64 | ||
| znorm | Inf | ||
| sky | -Inf | -Inf | -NaN |
| S/N | 18.6 | 31.8 | 33.0 |
| S/N(c) | 0.0 | 0.0 | 0.0 |
| SN(E/C) |
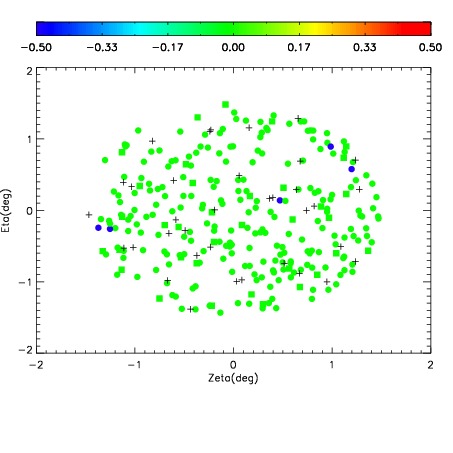
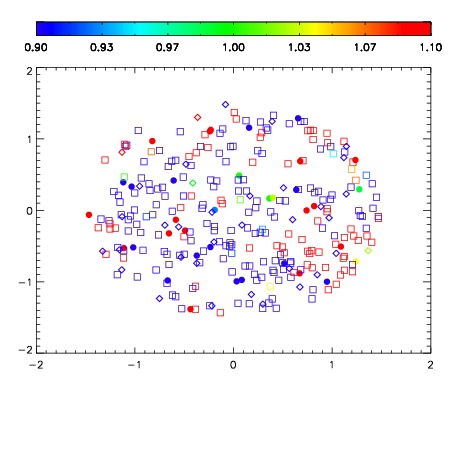
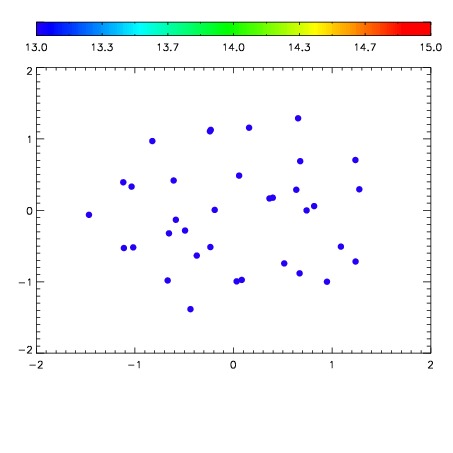

| Frame | Nreads | Zeropoints | Mag plots | Spatial mag deviation | Spatial sky 16325A emission deviations (filled: sky, open: star) | Spatial sky continuum emission | Spatial sky telluric CO2 absorption deviations (filled: H < 10) | |||||||||||||||||||||||
| 0 | 0 |
|
|
|
|
|
|
| IPAIR | NAME | SHIFT | NEWSHIFT | S/N | NAME | SHIFT | NEWSHIFT | S/N |
| 0 | 11980013 | 0.502107 | 0.00000 | 18.7118 | 11980014 | -0.00259525 | 0.504702 | 18.5898 |
| 1 | 11980012 | 0.502097 | 1.00136e-05 | 18.7370 | 11980018 | -0.00521465 | 0.507322 | 18.8695 |
| 2 | 11980017 | 0.501208 | 0.000899017 | 18.3442 | 11980011 | 0.00000 | 0.502107 | 18.5688 |
| 3 | 11980016 | 0.501979 | 0.000128031 | 16.7517 | 11980015 | -0.00255202 | 0.504659 | 18.4181 |