| Red | Green | Blue | |
| z | 17.64 | ||
| znorm | Inf | ||
| sky | -Inf | -Inf | -NaN |
| S/N | 21.8 | 40.2 | 42.1 |
| S/N(c) | 0.0 | 0.0 | 0.0 |
| SN(E/C) |
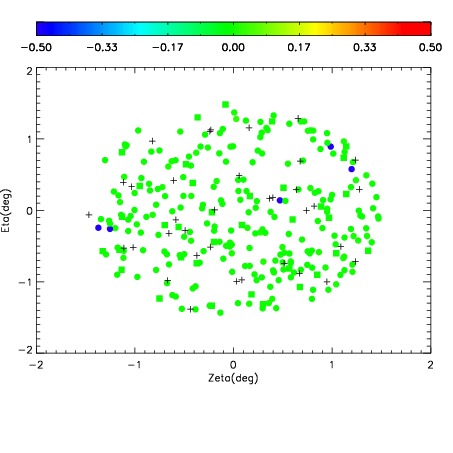

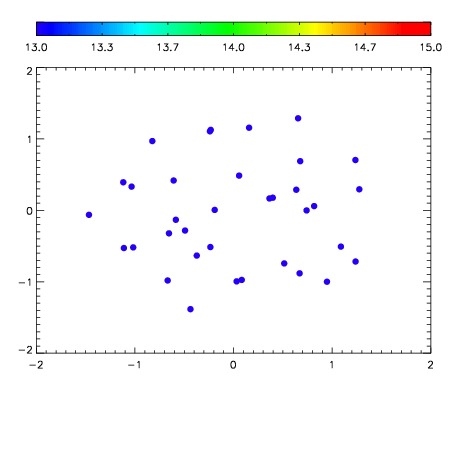

| Frame | Nreads | Zeropoints | Mag plots | Spatial mag deviation | Spatial sky 16325A emission deviations (filled: sky, open: star) | Spatial sky continuum emission | Spatial sky telluric CO2 absorption deviations (filled: H < 10) | |||||||||||||||||||||||
| 0 | 0 |
|
|
|
|
|
|
| IPAIR | NAME | SHIFT | NEWSHIFT | S/N | NAME | SHIFT | NEWSHIFT | S/N |
| 0 | 12230016 | 0.495391 | 0.00000 | 18.8289 | 12230014 | -0.00313466 | 0.498526 | 18.8824 |
| 1 | 12230017 | 0.495312 | 7.90060e-05 | 18.9352 | 12230015 | -0.00305394 | 0.498445 | 18.8894 |
| 2 | 12230013 | 0.493615 | 0.00177601 | 18.7804 | 12230018 | -0.00362174 | 0.499013 | 18.7502 |
| 3 | 12230012 | 0.493728 | 0.00166300 | 18.7617 | 12230011 | 0.00000 | 0.495391 | 18.7197 |