| Red | Green | Blue | |
| z | 17.64 | ||
| znorm | Inf | ||
| sky | -NaN | -NaN | -Inf |
| S/N | 26.9 | 45.8 | 49.2 |
| S/N(c) | 0.0 | 0.0 | 0.0 |
| SN(E/C) |
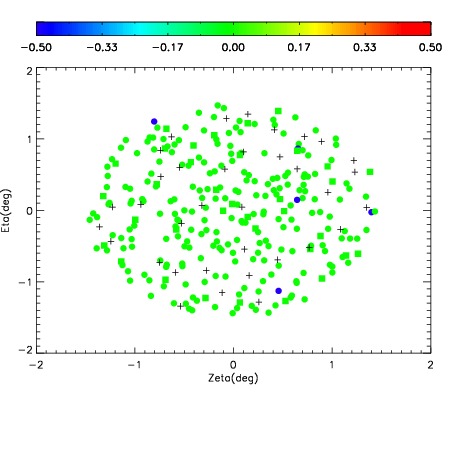

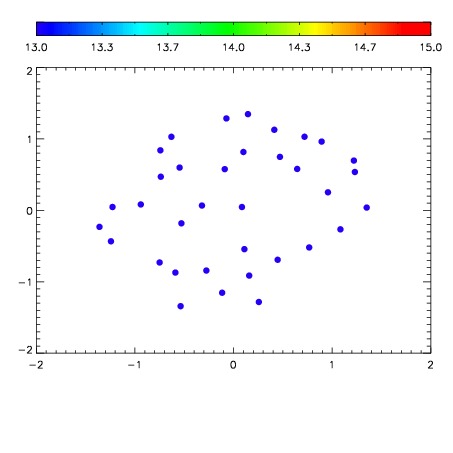

| Frame | Nreads | Zeropoints | Mag plots | Spatial mag deviation | Spatial sky 16325A emission deviations (filled: sky, open: star) | Spatial sky continuum emission | Spatial sky telluric CO2 absorption deviations (filled: H < 10) | |||||||||||||||||||||||
| 0 | 0 |
|
|
|
|
|
|
| IPAIR | NAME | SHIFT | NEWSHIFT | S/N | NAME | SHIFT | NEWSHIFT | S/N |
| 0 | 05230016 | 0.493864 | 0.00000 | 19.0925 | 05230014 | 0.000931000 | 0.492933 | 19.1105 |
| 1 | 05230015 | 0.493767 | 9.70066e-05 | 19.1084 | 05230017 | 0.00218634 | 0.491678 | 19.1315 |
| 2 | 05230011 | 0.492911 | 0.000952989 | 19.0268 | 05230013 | 0.000938969 | 0.492925 | 19.0819 |
| 3 | 05230012 | 0.493337 | 0.000526994 | 19.0249 | 05230010 | 0.00000 | 0.493864 | 19.0372 |