| Red | Green | Blue | |
| z | 17.63 | ||
| znorm | Inf | ||
| sky | -NaN | -NaN | -NaN |
| S/N | 17.2 | 32.4 | 34.9 |
| S/N(c) | 0.0 | 0.0 | 0.0 |
| SN(E/C) |
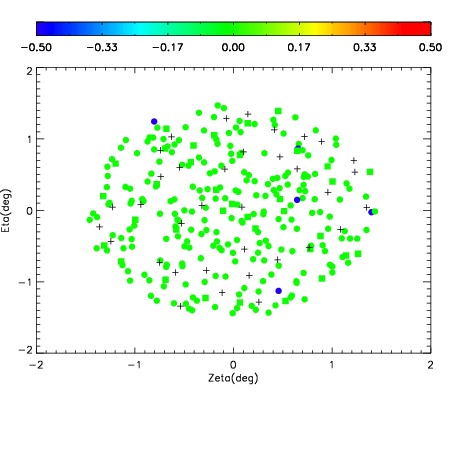
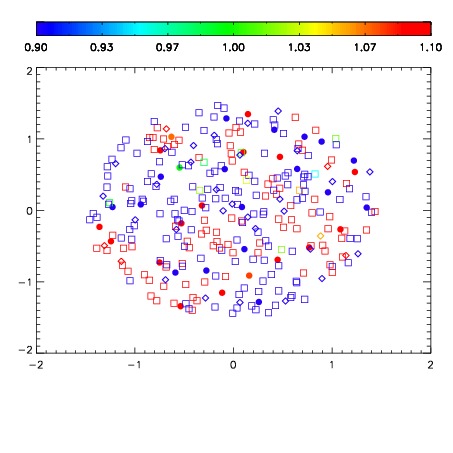
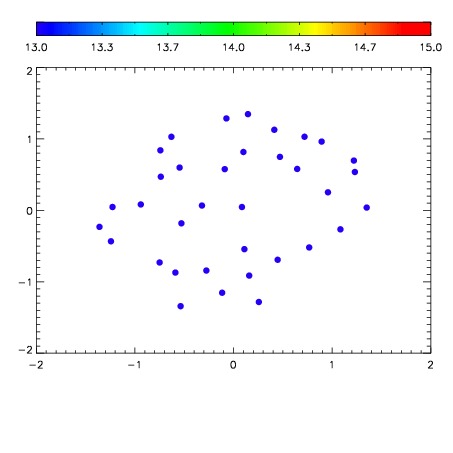

| Frame | Nreads | Zeropoints | Mag plots | Spatial mag deviation | Spatial sky 16325A emission deviations (filled: sky, open: star) | Spatial sky continuum emission | Spatial sky telluric CO2 absorption deviations (filled: H < 10) | |||||||||||||||||||||||
| 0 | 0 |
|
|
|
|
|
|
| IPAIR | NAME | SHIFT | NEWSHIFT | S/N | NAME | SHIFT | NEWSHIFT | S/N |
| 0 | 11760033 | 0.494516 | 0.00000 | 18.6127 | 11760039 | -0.00436622 | 0.498882 | 18.6018 |
| 1 | 11760038 | 0.493371 | 0.00114498 | 18.4886 | 11760032 | 0.00000 | 0.494516 | 18.5881 |
| 2 | 11760037 | 0.493497 | 0.00101897 | 18.3510 | 11760036 | -0.00172586 | 0.496242 | 18.1884 |
| 3 | 11760034 | 0.494447 | 6.89924e-05 | 18.3176 | 11760035 | -0.00197492 | 0.496491 | 18.1831 |