| Red | Green | Blue | |
| z | 17.64 | ||
| znorm | Inf | ||
| sky | -Inf | -NaN | -Inf |
| S/N | 20.1 | 34.5 | 37.1 |
| S/N(c) | 0.0 | 0.0 | 0.0 |
| SN(E/C) |
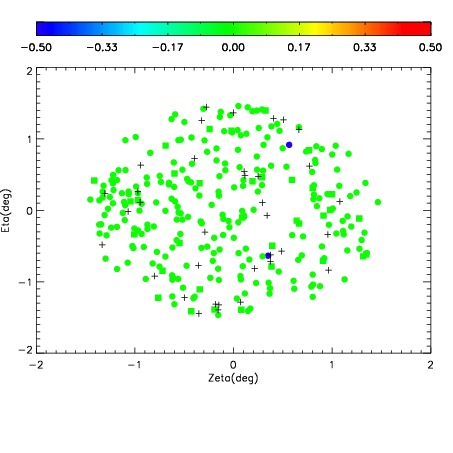
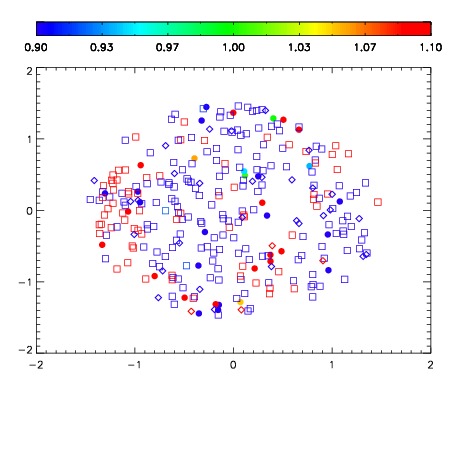
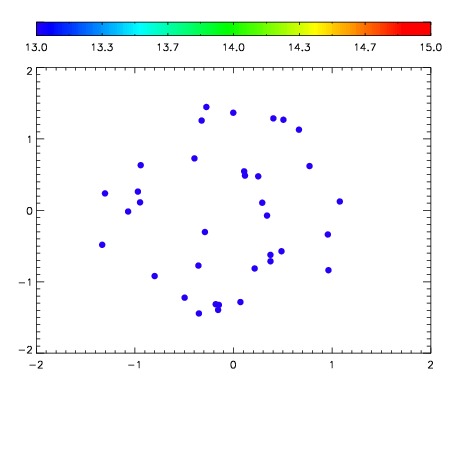

| Frame | Nreads | Zeropoints | Mag plots | Spatial mag deviation | Spatial sky 16325A emission deviations (filled: sky, open: star) | Spatial sky continuum emission | Spatial sky telluric CO2 absorption deviations (filled: H < 10) | |||||||||||||||||||||||
| 0 | 0 |
|
|
|
|
|
|
| IPAIR | NAME | SHIFT | NEWSHIFT | S/N | NAME | SHIFT | NEWSHIFT | S/N |
| 0 | 11730072 | 0.489697 | 0.00000 | 18.5408 | 11730070 | -0.00150437 | 0.491201 | 18.5358 |
| 1 | 11730068 | 0.489322 | 0.000375003 | 18.7778 | 11730073 | -0.00496178 | 0.494659 | 18.8571 |
| 2 | 11730067 | 0.489653 | 4.40180e-05 | 18.7248 | 11730066 | 0.00000 | 0.489697 | 18.8301 |
| 3 | 11730071 | 0.488976 | 0.000721008 | 18.3957 | 11730069 | -0.00127474 | 0.490972 | 18.1731 |