| Red | Green | Blue | |
| z | 17.64 | ||
| znorm | Inf | ||
| sky | -Inf | -NaN | -Inf |
| S/N | 28.2 | 47.2 | 49.8 |
| S/N(c) | 0.0 | 0.0 | 0.0 |
| SN(E/C) |
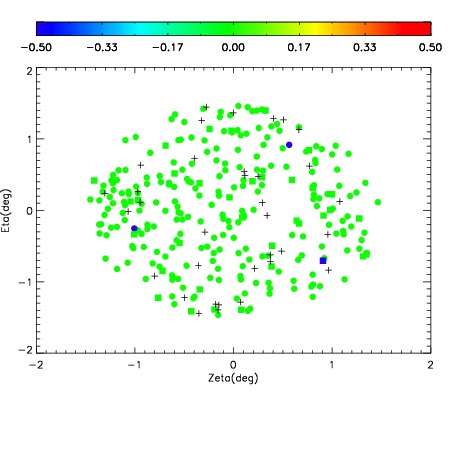
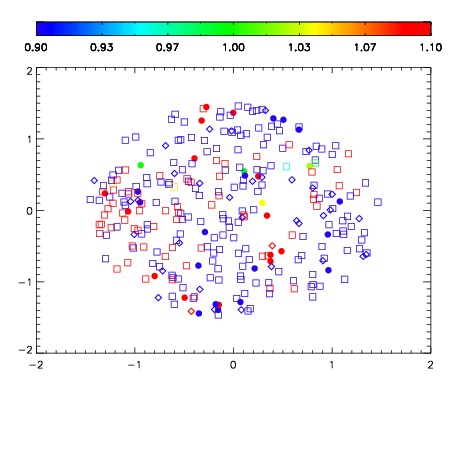
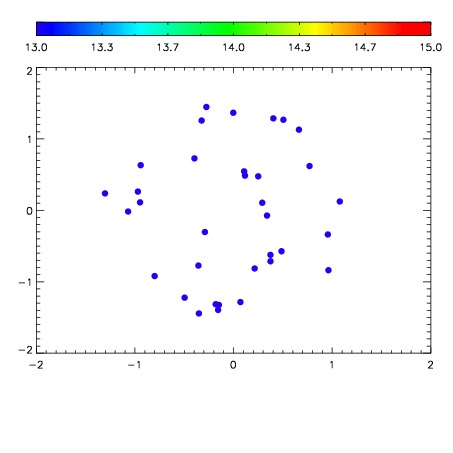

| Frame | Nreads | Zeropoints | Mag plots | Spatial mag deviation | Spatial sky 16325A emission deviations (filled: sky, open: star) | Spatial sky continuum emission | Spatial sky telluric CO2 absorption deviations (filled: H < 10) | |||||||||||||||||||||||
| 0 | 0 |
|
|
|
|
|
|
| IPAIR | NAME | SHIFT | NEWSHIFT | S/N | NAME | SHIFT | NEWSHIFT | S/N |
| 0 | 11780013 | 0.488589 | 0.00000 | 19.0567 | 11780015 | -0.00349789 | 0.492087 | 18.9196 |
| 1 | 11780017 | 0.486706 | 0.00188300 | 19.1368 | 11780018 | -0.00394137 | 0.492530 | 19.1432 |
| 2 | 11780012 | 0.487772 | 0.000817001 | 19.1325 | 11780011 | 0.00000 | 0.488589 | 19.1411 |
| 3 | 11780016 | 0.486928 | 0.00166100 | 19.0626 | 11780014 | -0.00360834 | 0.492197 | 18.9488 |