| Red | Green | Blue | |
| z | 17.64 | ||
| znorm | Inf | ||
| sky | -NaN | -NaN | -NaN |
| S/N | 27.1 | 44.9 | 48.5 |
| S/N(c) | 0.0 | 0.0 | 0.0 |
| SN(E/C) |

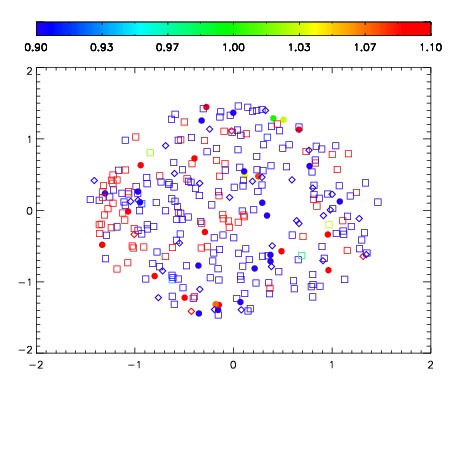
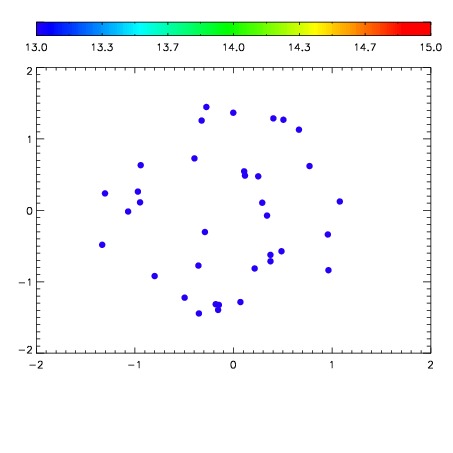

| Frame | Nreads | Zeropoints | Mag plots | Spatial mag deviation | Spatial sky 16325A emission deviations (filled: sky, open: star) | Spatial sky continuum emission | Spatial sky telluric CO2 absorption deviations (filled: H < 10) | |||||||||||||||||||||||
| 0 | 0 |
|
|
|
|
|
|
| IPAIR | NAME | SHIFT | NEWSHIFT | S/N | NAME | SHIFT | NEWSHIFT | S/N |
| 0 | 12000046 | 0.498475 | 0.00000 | 18.9728 | 12000044 | 0.00000 | 0.498475 | 18.8567 |
| 1 | 12000050 | 0.498312 | 0.000162989 | 19.1380 | 12000051 | -0.00335953 | 0.501835 | 19.1756 |
| 2 | 12000049 | 0.497650 | 0.000824988 | 19.0997 | 12000048 | -0.00228174 | 0.500757 | 19.0832 |
| 3 | 12000045 | 0.497816 | 0.000658989 | 18.9873 | 12000047 | -0.00211243 | 0.500587 | 19.0490 |