| Red | Green | Blue | |
| z | 17.64 | ||
| znorm | Inf | ||
| sky | -Inf | -Inf | -Inf |
| S/N | 27.3 | 46.4 | 50.1 |
| S/N(c) | 0.0 | 0.0 | 0.0 |
| SN(E/C) |
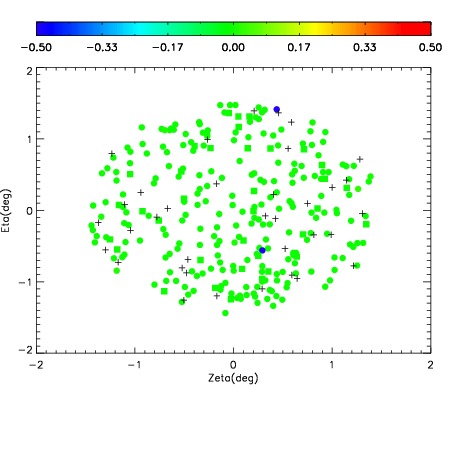
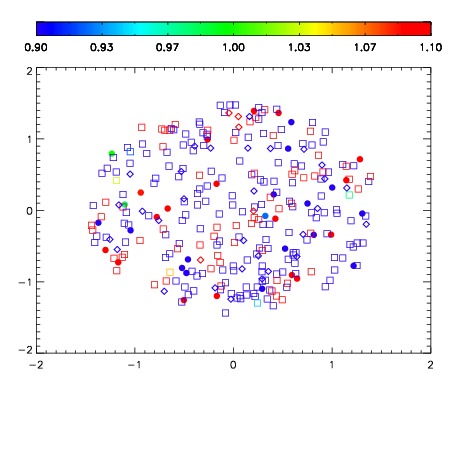
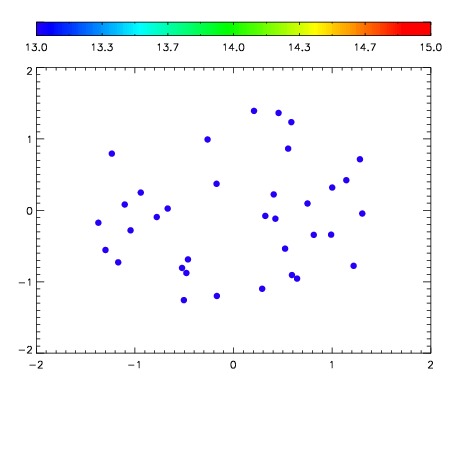

| Frame | Nreads | Zeropoints | Mag plots | Spatial mag deviation | Spatial sky 16325A emission deviations (filled: sky, open: star) | Spatial sky continuum emission | Spatial sky telluric CO2 absorption deviations (filled: H < 10) | |||||||||||||||||||||||
| 0 | 0 |
|
|
|
|
|
|
| IPAIR | NAME | SHIFT | NEWSHIFT | S/N | NAME | SHIFT | NEWSHIFT | S/N |
| 0 | 11470050 | 0.481269 | 0.00000 | 19.0369 | 11470051 | 0.000609612 | 0.480659 | 19.0479 |
| 1 | 11470049 | 0.480645 | 0.000624001 | 18.9964 | 11470048 | -0.00190649 | 0.483175 | 18.9840 |
| 2 | 11470046 | 0.478322 | 0.00294700 | 18.9956 | 11470047 | -0.00192338 | 0.483192 | 18.9546 |
| 3 | 11470045 | 0.477920 | 0.00334901 | 18.9888 | 11470044 | 0.00000 | 0.481269 | 18.9378 |