| Red | Green | Blue | |
| z | 17.64 | ||
| znorm | Inf | ||
| sky | -Inf | -Inf | -NaN |
| S/N | 27.7 | 46.7 | 48.7 |
| S/N(c) | 0.0 | 0.0 | 0.0 |
| SN(E/C) |
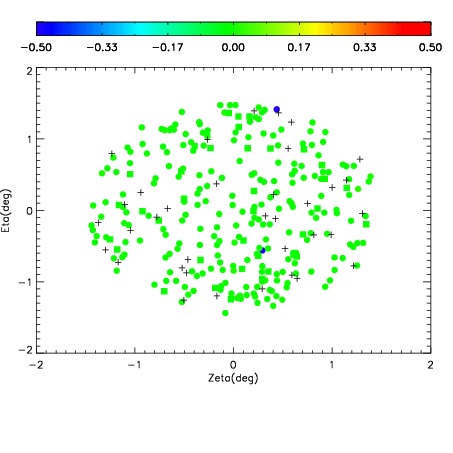
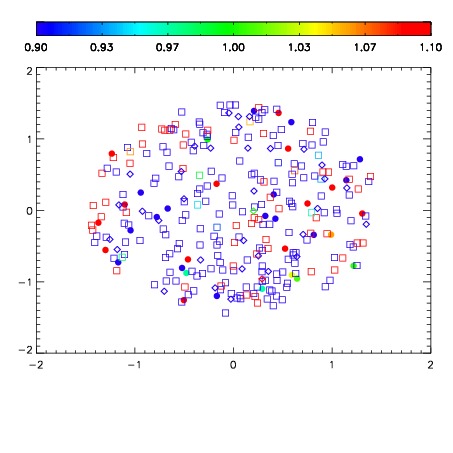
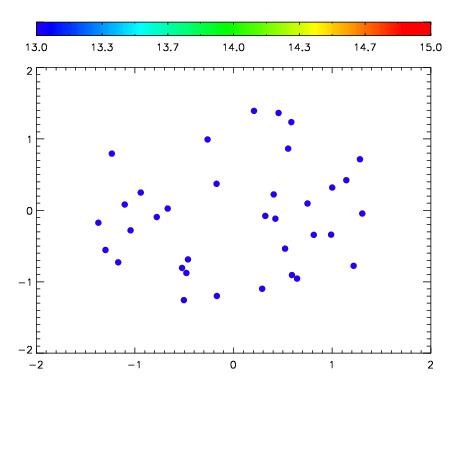

| Frame | Nreads | Zeropoints | Mag plots | Spatial mag deviation | Spatial sky 16325A emission deviations (filled: sky, open: star) | Spatial sky continuum emission | Spatial sky telluric CO2 absorption deviations (filled: H < 10) | |||||||||||||||||||||||
| 0 | 0 |
|
|
|
|
|
|
| IPAIR | NAME | SHIFT | NEWSHIFT | S/N | NAME | SHIFT | NEWSHIFT | S/N |
| 0 | 11550012 | 0.472584 | 0.00000 | 18.2672 | 11550015 | -0.00225872 | 0.474843 | 18.4847 |
| 1 | 11550020 | 0.471201 | 0.00138301 | 19.0726 | 11550019 | -0.00421841 | 0.476802 | 19.1001 |
| 2 | 11550017 | 0.470517 | 0.00206700 | 18.9795 | 11550018 | -0.00410520 | 0.476689 | 19.0758 |
| 3 | 11550016 | 0.471381 | 0.00120300 | 18.8958 | 11550014 | -0.00363131 | 0.476215 | 18.8907 |
| 4 | 11550013 | 0.472152 | 0.000432014 | 18.6288 | 11550011 | 0.00000 | 0.472584 | 18.5994 |