| Red | Green | Blue | |
| z | 17.64 | ||
| znorm | Inf | ||
| sky | -Inf | -Inf | -Inf |
| S/N | 25.3 | 45.0 | 47.2 |
| S/N(c) | 0.0 | 0.0 | 0.0 |
| SN(E/C) |
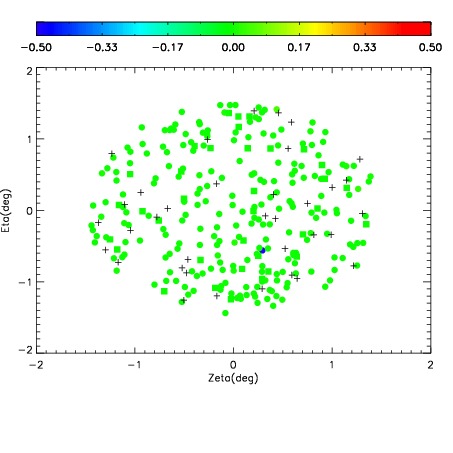
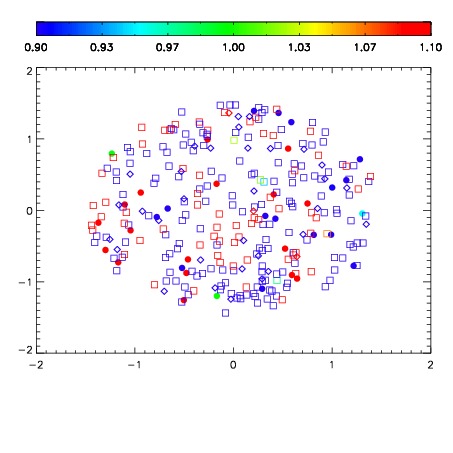
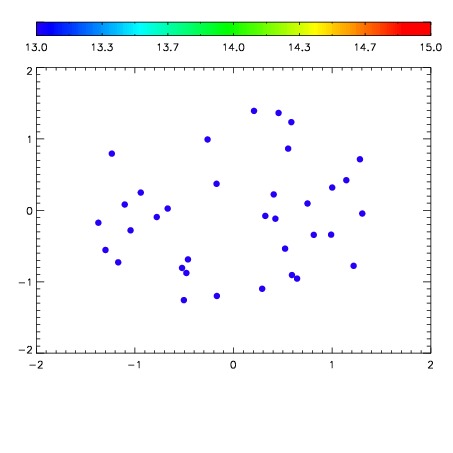

| Frame | Nreads | Zeropoints | Mag plots | Spatial mag deviation | Spatial sky 16325A emission deviations (filled: sky, open: star) | Spatial sky continuum emission | Spatial sky telluric CO2 absorption deviations (filled: H < 10) | |||||||||||||||||||||||
| 0 | 0 |
|
|
|
|
|
|
| IPAIR | NAME | SHIFT | NEWSHIFT | S/N | NAME | SHIFT | NEWSHIFT | S/N |
| 0 | 11730083 | 0.496281 | 0.00000 | 18.9451 | 11730084 | -0.00433615 | 0.500617 | 18.9438 |
| 1 | 11730082 | 0.495842 | 0.000438988 | 19.0093 | 11730077 | 0.00000 | 0.496281 | 18.9557 |
| 2 | 11730078 | 0.489955 | 0.00632599 | 18.8727 | 11730080 | -0.00355698 | 0.499838 | 18.9011 |
| 3 | 11730079 | 0.490366 | 0.00591499 | 18.6740 | 11730081 | -0.00317198 | 0.499453 | 18.8490 |