| Red | Green | Blue | |
| z | 17.64 | ||
| znorm | Inf | ||
| sky | -Inf | -NaN | -NaN |
| S/N | 28.2 | 45.0 | 49.5 |
| S/N(c) | 0.0 | 0.0 | 0.0 |
| SN(E/C) |
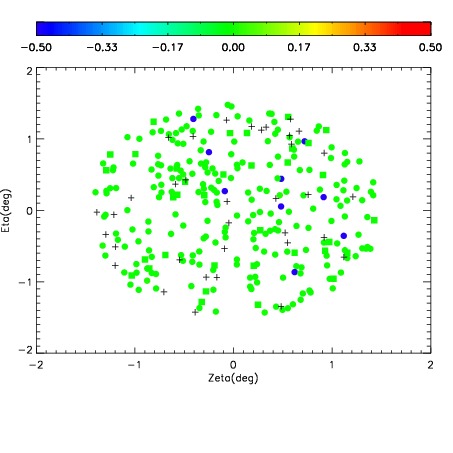


| Frame | Nreads | Zeropoints | Mag plots | Spatial mag deviation | Spatial sky 16325A emission deviations (filled: sky, open: star) | Spatial sky continuum emission | Spatial sky telluric CO2 absorption deviations (filled: H < 10) | |||||||||||||||||||||||
| 0 | 0 |
|
|
|
|
|
|
| IPAIR | NAME | SHIFT | NEWSHIFT | S/N | NAME | SHIFT | NEWSHIFT | S/N |
| 0 | 05230027 | 0.495097 | 0.00000 | 19.0897 | 05230025 | 0.00199644 | 0.493101 | 19.1007 |
| 1 | 05230022 | 0.493488 | 0.00160900 | 19.1019 | 05230028 | 0.000940323 | 0.494157 | 19.1417 |
| 2 | 05230023 | 0.493496 | 0.00160101 | 19.0979 | 05230024 | 0.000903114 | 0.494194 | 19.1116 |
| 3 | 05230026 | 0.494653 | 0.000444025 | 19.0714 | 05230021 | 0.00000 | 0.495097 | 19.0895 |