| Red | Green | Blue | |
| z | 17.64 | ||
| znorm | Inf | ||
| sky | -Inf | -Inf | -Inf |
| S/N | 20.6 | 37.5 | 39.1 |
| S/N(c) | 0.0 | 0.0 | 0.0 |
| SN(E/C) |
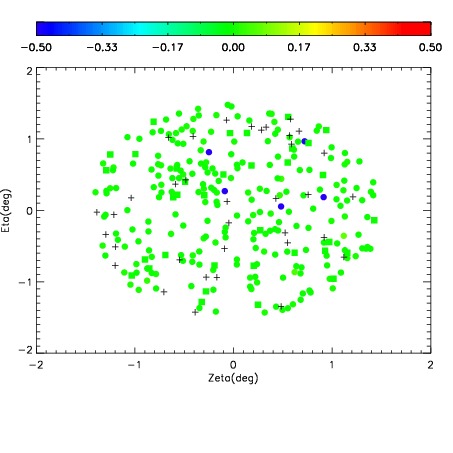
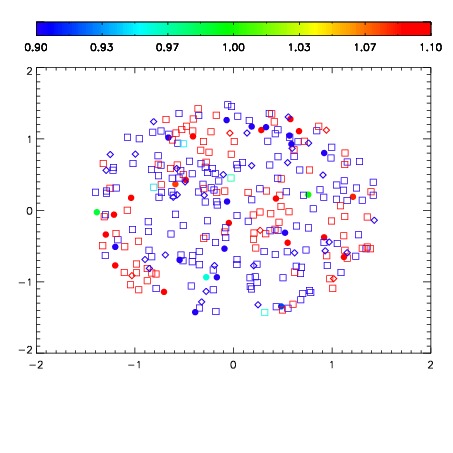
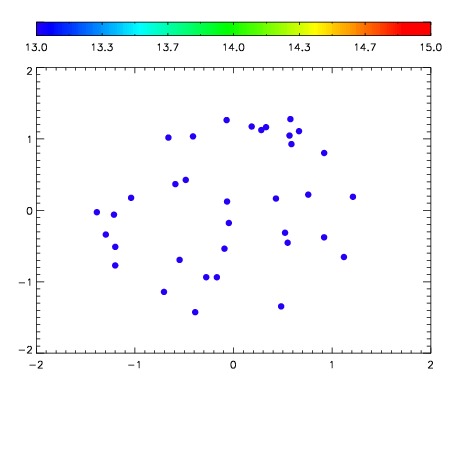

| Frame | Nreads | Zeropoints | Mag plots | Spatial mag deviation | Spatial sky 16325A emission deviations (filled: sky, open: star) | Spatial sky continuum emission | Spatial sky telluric CO2 absorption deviations (filled: H < 10) | |||||||||||||||||||||||
| 0 | 0 |
|
|
|
|
|
|
| IPAIR | NAME | SHIFT | NEWSHIFT | S/N | NAME | SHIFT | NEWSHIFT | S/N |
| 0 | 08760039 | 0.481234 | 0.00000 | 18.4595 | 08760040 | 0.00562468 | 0.475609 | 18.3030 |
| 1 | 08760038 | 0.480872 | 0.000362009 | 18.8184 | 08760037 | 0.00000 | 0.481234 | 18.8139 |
| 2 | 08760043 | 0.478250 | 0.00298402 | 18.5326 | 08760044 | 0.00400163 | 0.477232 | 18.5451 |
| 3 | 08760042 | 0.478135 | 0.00309902 | 18.4751 | 08760041 | 0.00461386 | 0.476620 | 18.5271 |