| Red | Green | Blue | |
| z | 17.64 | ||
| znorm | Inf | ||
| sky | -NaN | -NaN | -Inf |
| S/N | 28.0 | 47.5 | 51.6 |
| S/N(c) | 0.0 | 0.0 | 0.0 |
| SN(E/C) |
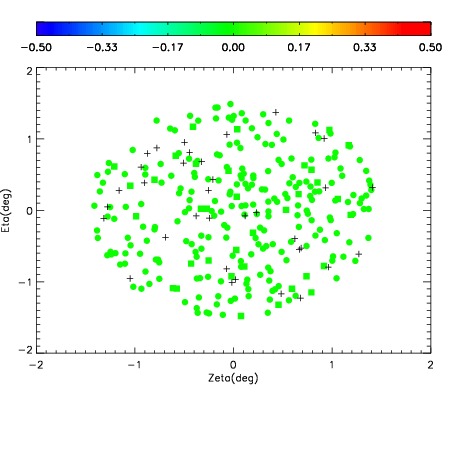
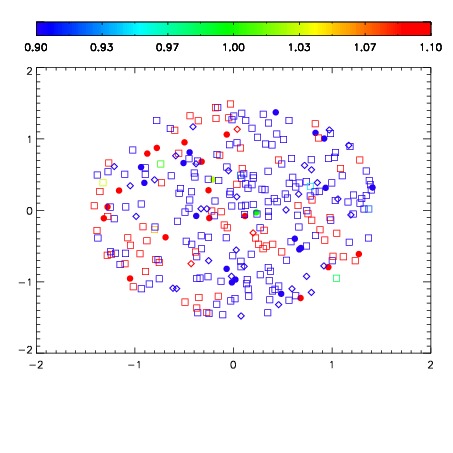


| Frame | Nreads | Zeropoints | Mag plots | Spatial mag deviation | Spatial sky 16325A emission deviations (filled: sky, open: star) | Spatial sky continuum emission | Spatial sky telluric CO2 absorption deviations (filled: H < 10) | |||||||||||||||||||||||
| 0 | 0 |
|
|
|
|
|
|
| IPAIR | NAME | SHIFT | NEWSHIFT | S/N | NAME | SHIFT | NEWSHIFT | S/N |
| 0 | 05230038 | 0.492647 | 0.00000 | 19.0927 | 05230040 | -4.39041e-06 | 0.492651 | 19.1183 |
| 1 | 05230042 | 0.492595 | 5.20051e-05 | 19.1466 | 05230043 | 0.00419775 | 0.488449 | 19.1377 |
| 2 | 05230041 | 0.491241 | 0.00140598 | 19.1237 | 05230039 | 0.00239032 | 0.490257 | 19.1190 |
| 3 | 05230037 | 0.492511 | 0.000135988 | 19.0652 | 05230036 | 0.00000 | 0.492647 | 19.1048 |